Unlock a world of possibilities! Login now and discover the exclusive benefits awaiting you.
- Qlik Community
- :
- All Forums
- :
- QlikView App Dev
- :
- How to see Null lines in chart
- Subscribe to RSS Feed
- Mark Topic as New
- Mark Topic as Read
- Float this Topic for Current User
- Bookmark
- Subscribe
- Mute
- Printer Friendly Page
- Mark as New
- Bookmark
- Subscribe
- Mute
- Subscribe to RSS Feed
- Permalink
- Report Inappropriate Content
How to see Null lines in chart
Hi, QlikView community
I have two datasets in my qlikview report.
The table companies shows all the companies in the data.
In the dataset there can no companies and three companies in a %key
| %key | Company Name | Company Type |
| 1 | Disney | CEE |
| 1 | Walmart | SHP |
| 1 | Coca Cola | CAR |
| 2 | Apple | CEE |
| 2 | Maersk | CAR |
The table Job Ref shows the name of the job ref and the amount on the job ref.
And the %key connects the data
| %key | Job Ref | Amount |
| 1 | Florida1 | 100 |
| 2 | Florida2 | 220 |
| 3 | Kansas1 | 320 |
And what I am trying to show in my chart is every Company that is Company Type = 'SHP' and if there is shipper for Job Ref I want the chart to show Null.
I want the chart to show this
Company Name Amount
Walmart 100
- 540
I don't if it is best to have calculated dimension or in the script
Accepted Solutions
- Mark as New
- Bookmark
- Subscribe
- Mute
- Subscribe to RSS Feed
- Permalink
- Report Inappropriate Content
Hi
it could be that :
with two dimensions :
dimension :
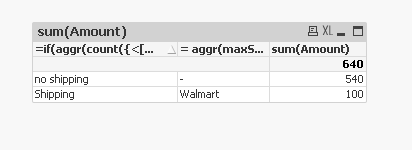
=if(aggr(count({<[Company Type] = {SHP} >} %key),%key)>0, 'Shipping','no shipping')
= aggr(maxString(if([Company Type]='SHP',[Company Name])),%key)
regards
- Mark as New
- Bookmark
- Subscribe
- Mute
- Subscribe to RSS Feed
- Permalink
- Report Inappropriate Content
Hi,
maybe stalwar1 can take a look here ?
- Mark as New
- Bookmark
- Subscribe
- Mute
- Subscribe to RSS Feed
- Permalink
- Report Inappropriate Content
Can you explain the logic we need to apply for requirement?
How you got?
Company Name Amount
Walmart 100
- 540
- Mark as New
- Bookmark
- Subscribe
- Mute
- Subscribe to RSS Feed
- Permalink
- Report Inappropriate Content
Hi
it could be that :
with two dimensions :
dimension :
=if(aggr(count({<[Company Type] = {SHP} >} %key),%key)>0, 'Shipping','no shipping')
= aggr(maxString(if([Company Type]='SHP',[Company Name])),%key)
regards