Unlock a world of possibilities! Login now and discover the exclusive benefits awaiting you.
- Qlik Community
- :
- All Forums
- :
- QlikView App Dev
- :
- How to see only the Top Sellers Based on Rating on...
- Subscribe to RSS Feed
- Mark Topic as New
- Mark Topic as Read
- Float this Topic for Current User
- Bookmark
- Subscribe
- Mute
- Printer Friendly Page
- Mark as New
- Bookmark
- Subscribe
- Mute
- Subscribe to RSS Feed
- Permalink
- Report Inappropriate Content
How to see only the Top Sellers Based on Rating on table
I need some help , I am trying to create a table in which I am trying to show the highest seller symbol based on risk.
When I load this into qlikview , I see all but I want to see highest distinct level based on Risk. So for AA I just want to see Very High, for CC I just want to see High.
I would also like to be able to alternate between the two in a separate view, can someone please help, thousand thanks
| Seller Symbol | Risk | Level |
| AA | High | 3 |
| AA | Low | 1 |
| AA | Very High | 4 |
| BB | Medium | 2 |
| CC | Medium | 3 |
| CC | High | 3 |
| DD | Low | 1 |
| DD | High | 3 |
| EE | Medium | 2 |
| FF | High | 3 |
| GG | High | 3 |
| GG | Medium | 2 |
- « Previous Replies
-
- 1
- 2
- Next Replies »
Accepted Solutions
- Mark as New
- Bookmark
- Subscribe
- Mute
- Subscribe to RSS Feed
- Permalink
- Report Inappropriate Content
dimension: symbol
expression: firstsortedvalue(risk,-value)
//script
data:
LOAD
A as symbol,
B as risk,
C as value
FROM
- Mark as New
- Bookmark
- Subscribe
- Mute
- Subscribe to RSS Feed
- Permalink
- Report Inappropriate Content
dimension: symbol
expression: firstsortedvalue(risk,-value)
//script
data:
LOAD
A as symbol,
B as risk,
C as value
FROM
- Mark as New
- Bookmark
- Subscribe
- Mute
- Subscribe to RSS Feed
- Permalink
- Report Inappropriate Content
Hi,
If level goes hand in hand with risk, I think you can you this as a dimension
=AGGR(FirstSortedValue(Risk,-Level),[Seller Symbol])
What do you mean with Alternate between the two?
Luis
- Mark as New
- Bookmark
- Subscribe
- Mute
- Subscribe to RSS Feed
- Permalink
- Report Inappropriate Content
You can use alternative state for objects in your application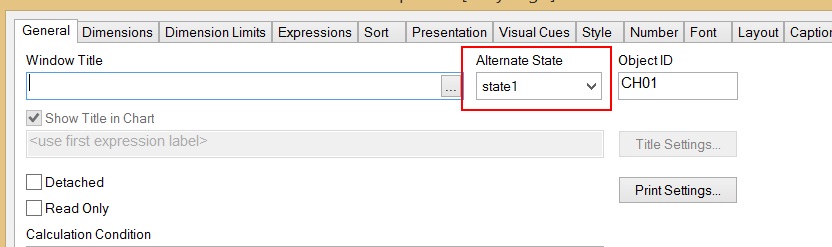
- Mark as New
- Bookmark
- Subscribe
- Mute
- Subscribe to RSS Feed
- Permalink
- Report Inappropriate Content
- Mark as New
- Bookmark
- Subscribe
- Mute
- Subscribe to RSS Feed
- Permalink
- Report Inappropriate Content
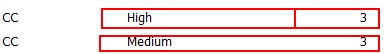
I am getting double results still when i put the formula in my table
- Mark as New
- Bookmark
- Subscribe
- Mute
- Subscribe to RSS Feed
- Permalink
- Report Inappropriate Content
application should working fine. Look at excel file because high and medium have the same level.
FirstSortedValue - chart function ‒ Qlik Sense
- Mark as New
- Bookmark
- Subscribe
- Mute
- Subscribe to RSS Feed
- Permalink
- Report Inappropriate Content
Hi Mike,
For the ones that are missing, it's because there are more than one value that meet the criteria. Level has incorrect values. You could get rid of Level as you have it and create a table like this that will associate automatically
Levels:
Risk,Level
Low,1
Medium,2
High,3
Very High, 4];
The correct answer is Mariusz' response once you have fixed the data
I hope this helps,
Cheers,
Luis
- Mark as New
- Bookmark
- Subscribe
- Mute
- Subscribe to RSS Feed
- Permalink
- Report Inappropriate Content
Oh forgot to say,
What I did using AGGR is a workaround to place something as a Dimension and not as a measure
Cheers,
Luis
- Mark as New
- Bookmark
- Subscribe
- Mute
- Subscribe to RSS Feed
- Permalink
- Report Inappropriate Content
Hi Mike,
Script:
Data:
LOAD [Seller Symbol],
Risk,
Level,
Pick(Match(Risk,'Low','Medium','High','Very High'),1,2,3,4) as NewLevel
FROM
Source;
Front End Chart:
Dimension: [Seller Symbol]
Expression: FirstSortedValue(Risk,-NewLevel)
Result:
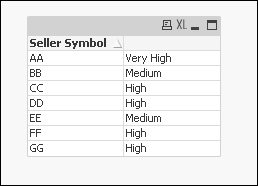
Note: If you have same duplicates in Seller Symbol and Risk columns, you can use "Distinct" in FirstSortedValue function.
- « Previous Replies
-
- 1
- 2
- Next Replies »