Unlock a world of possibilities! Login now and discover the exclusive benefits awaiting you.
- Qlik Community
- :
- All Forums
- :
- QlikView App Dev
- :
- Re: How to set up dynamic monthly counts in "text ...
- Subscribe to RSS Feed
- Mark Topic as New
- Mark Topic as Read
- Float this Topic for Current User
- Bookmark
- Subscribe
- Mute
- Printer Friendly Page
- Mark as New
- Bookmark
- Subscribe
- Mute
- Subscribe to RSS Feed
- Permalink
- Report Inappropriate Content
How to set up dynamic monthly counts in "text in chart" field
Our client requested the following text on the top of a chart:
Feb 2013 (n=100) Mar 2013 (n=200) Apr (n=300) ... up to the last month
I would really like to set that up dynamically like it is possible in a list box by MYear with calculated expression
=' (n='&Count(MYear)&')'
MYear is calculated on the load like
LOAD MonthName(Monthstart(date(DATEFILED))) as MYear
Any help is greatly appreciated
Thank you very much!
- « Previous Replies
-
- 1
- 2
- Next Replies »
- Mark as New
- Bookmark
- Subscribe
- Mute
- Subscribe to RSS Feed
- Permalink
- Report Inappropriate Content
That's why I wanted to use a text in chart field
- Mark as New
- Bookmark
- Subscribe
- Mute
- Subscribe to RSS Feed
- Permalink
- Report Inappropriate Content
Can anyone explain me why the following expression works in a chart text field
=MonthName(Min(MYear))&' (n='&Count({<MYear={'Feb 2013'}>} MYear)&')'
but the next (dynamic one) doesn't work
=MonthName(Min(MYear))&' (n='&Count({<MYear={"=$(=MonthName(Min(MYear)))"}>} MYear)&')'
- Mark as New
- Bookmark
- Subscribe
- Mute
- Subscribe to RSS Feed
- Permalink
- Report Inappropriate Content
There is one '=' too many and double quotes should be single
=MonthName(Min(MYear))&' (n='&Count({<MYear={'$(=Month(Min(MYear)))'}>} MYear)&')'
- Mark as New
- Bookmark
- Subscribe
- Mute
- Subscribe to RSS Feed
- Permalink
- Report Inappropriate Content
Oh and I tested something that could work for you as text in chart, used an old qvw with months and sample sizes in them...
=Concat(DISTINCT Maand&' (n='&aggr(sum(if(num(measure)>0,1,0)),Maand)&')',' , ')
- Mark as New
- Bookmark
- Subscribe
- Mute
- Subscribe to RSS Feed
- Permalink
- Report Inappropriate Content
Very very close!
But months are repeating in alphabetical order, see below:
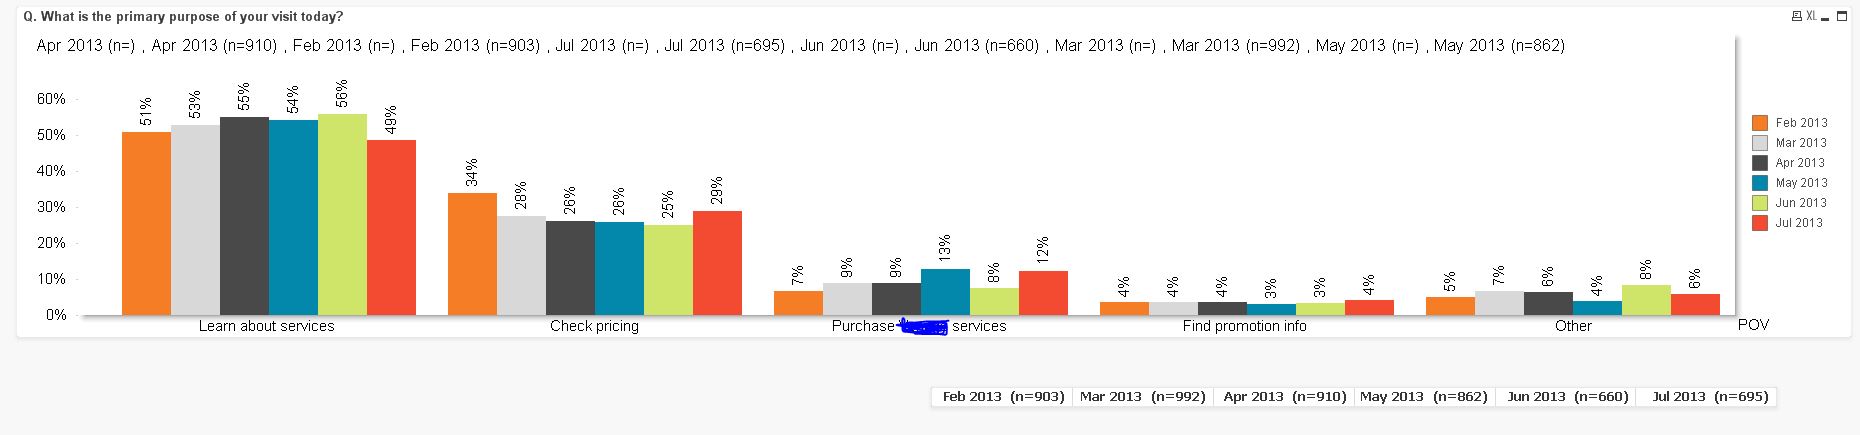
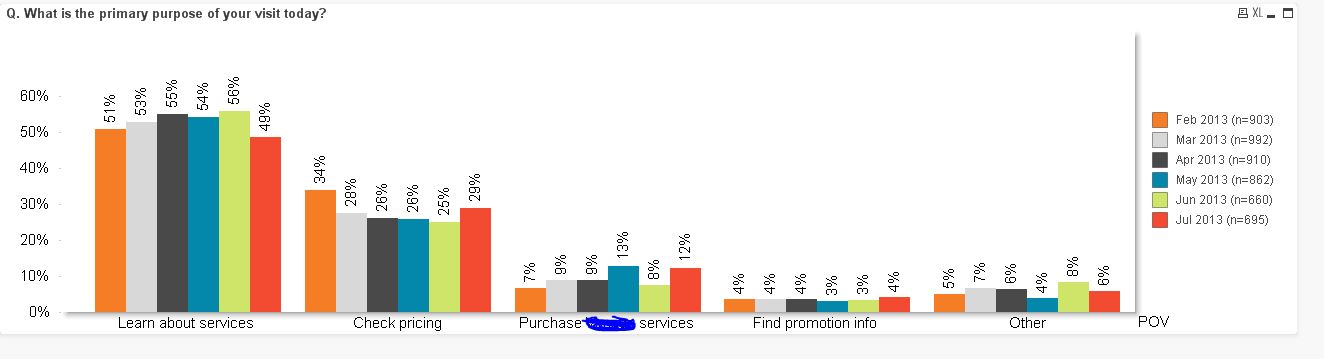
Under the chart you can see what I'm planning to get.
- Mark as New
- Bookmark
- Subscribe
- Mute
- Subscribe to RSS Feed
- Permalink
- Report Inappropriate Content
Are your months the MYear field? If so try creating it as
date(Monthstart(DATEFIELD),'MMM YYYY') as MYear
And then sort it numerically instead of as text.
talk is cheap, supply exceeds demand
- Mark as New
- Bookmark
- Subscribe
- Mute
- Subscribe to RSS Feed
- Permalink
- Report Inappropriate Content
The last post doesn't work, but there is another solution:
to use calculated dimension as
=MYear&' (n='&aggr(Count(MYear),MYear)&')'
- « Previous Replies
-
- 1
- 2
- Next Replies »