Unlock a world of possibilities! Login now and discover the exclusive benefits awaiting you.
- Qlik Community
- :
- All Forums
- :
- QlikView App Dev
- :
- How to set variable bounds in gauge charts?
- Subscribe to RSS Feed
- Mark Topic as New
- Mark Topic as Read
- Float this Topic for Current User
- Bookmark
- Subscribe
- Mute
- Printer Friendly Page
- Mark as New
- Bookmark
- Subscribe
- Mute
- Subscribe to RSS Feed
- Permalink
- Report Inappropriate Content
How to set variable bounds in gauge charts?
Hi everyone!
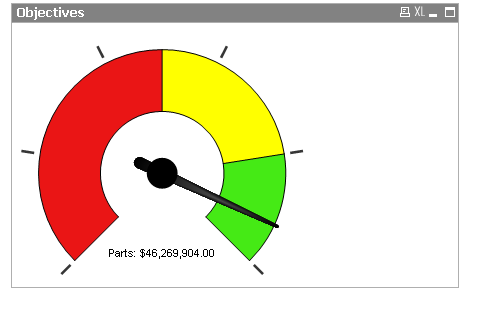
I hope you all are doing well. I'm new to QlikView, and I'm trying to set the max of a gauge chart to be 10% more than the highest value of the user's selection. I also want the min to be 0, and therefore the lower bound of the red to be zero. I want the lower bound of the yellow to be half the sum of the user's selection. I want the lower bound of the green to be 3/4 of the sum of the user's selection. The formulas that I'm currently using are:
Max:=(sum(Data))*(1.1)
Yellow lower bound: =(sum(Data))/2
Green lower bound: =(sum(data))*(3/4)
I've also attached a screenshot of what it currently looks like (the all green chart) and what it should look like. Thanks for all your help!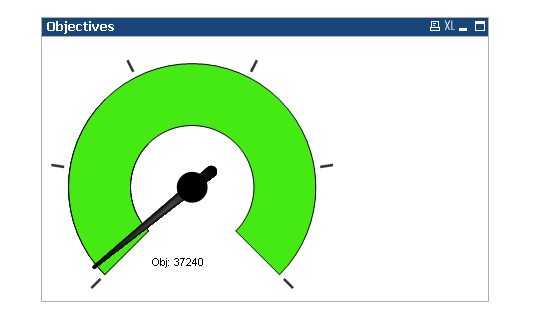
- Mark as New
- Bookmark
- Subscribe
- Mute
- Subscribe to RSS Feed
- Permalink
- Report Inappropriate Content
Hi Elizabeth,
please look at attached app.
I hope it helps you
Best regards
Andrea
- Mark as New
- Bookmark
- Subscribe
- Mute
- Subscribe to RSS Feed
- Permalink
- Report Inappropriate Content
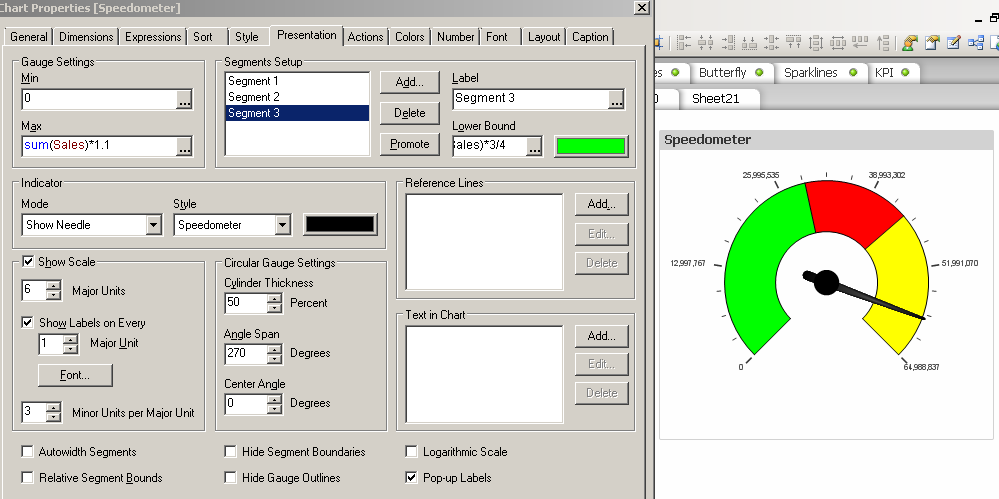
your settings work for me (just used sum(Sales) instead of your exp)
uncheck relative in expression?
number format integer?