Unlock a world of possibilities! Login now and discover the exclusive benefits awaiting you.
- Qlik Community
- :
- All Forums
- :
- QlikView App Dev
- :
- Re: How to show Count and Percentage on the Pie ch...
- Subscribe to RSS Feed
- Mark Topic as New
- Mark Topic as Read
- Float this Topic for Current User
- Bookmark
- Subscribe
- Mute
- Printer Friendly Page
- Mark as New
- Bookmark
- Subscribe
- Mute
- Subscribe to RSS Feed
- Permalink
- Report Inappropriate Content
How to show Count and Percentage on the Pie chart visual ?
Hello,
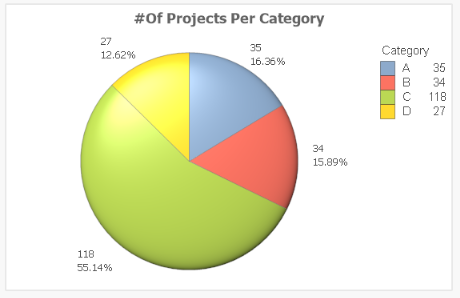
I have the below Pie Chart which shows the No of Projects per Category;
When I uncheck the relative under my expression I am getting the count of the projects as shown below;
How Can I get both percentages and count of the projects in my Pie chart visual? any help is greatly appreciated.
thanks
Bhavesh
Accepted Solutions
- Mark as New
- Bookmark
- Subscribe
- Mute
- Subscribe to RSS Feed
- Permalink
- Report Inappropriate Content
Couple of answers that work here, I find the easiest option to be to simply add a second expression with the exact same expression (for example Count(Project)), and tick relative for one of the expressions and leave it off for the other. Check Value on data points for both and you should have what you want. Example:

You won't be able to see the percentage in the legend though, you'll have to use Nassim's solution for that.
- Mark as New
- Bookmark
- Subscribe
- Mute
- Subscribe to RSS Feed
- Permalink
- Report Inappropriate Content
You need to use dual function.
something like
dual( your_sum_expression & ' - ' & your_percent_expression,your_sum_expression)
something like
dual(Num(Sum(Sales),'0,000.00') & '-' & num((Sum(Sales)/Sum(TOTAL Sales))*100,'0.00') & '%',
Num(Sum(Sales),'0,000.00'))
- Mark as New
- Bookmark
- Subscribe
- Mute
- Subscribe to RSS Feed
- Permalink
- Report Inappropriate Content
Hi,
just add a calculated dimension as
=Category&' : '& aggr(num(sum(#Projects)/sum(total{<Category>} #Projects),'#,##0.00%'),Category)
and the expression is :
sum(#Projects)
and don't select relative check box .
thanks
nassim
- Mark as New
- Bookmark
- Subscribe
- Mute
- Subscribe to RSS Feed
- Permalink
- Report Inappropriate Content
Couple of answers that work here, I find the easiest option to be to simply add a second expression with the exact same expression (for example Count(Project)), and tick relative for one of the expressions and leave it off for the other. Check Value on data points for both and you should have what you want. Example:

You won't be able to see the percentage in the legend though, you'll have to use Nassim's solution for that.
- Mark as New
- Bookmark
- Subscribe
- Mute
- Subscribe to RSS Feed
- Permalink
- Report Inappropriate Content
That was the easiest thing to do. thank you ![]()
- Mark as New
- Bookmark
- Subscribe
- Mute
- Subscribe to RSS Feed
- Permalink
- Report Inappropriate Content
can this be expanded to a second dimension? so not just "category", but say, "category" and "projectowner" where project owner could be a list of names