Unlock a world of possibilities! Login now and discover the exclusive benefits awaiting you.
- Qlik Community
- :
- All Forums
- :
- QlikView App Dev
- :
- How to show Month wise Sales
- Subscribe to RSS Feed
- Mark Topic as New
- Mark Topic as Read
- Float this Topic for Current User
- Bookmark
- Subscribe
- Mute
- Printer Friendly Page
- Mark as New
- Bookmark
- Subscribe
- Mute
- Subscribe to RSS Feed
- Permalink
- Report Inappropriate Content
How to show Month wise Sales
Hi,
Here i have requirment like i have to show the month wise tickets in line chart,, how to break the year wise tickets into month wise...
In DB i have date column there i have 2011 tickets created in a oraganization.
what i did here is i have return calender script to showmonth names in X-axis and in expression i took Total count of ticketsbut its not giving correct result
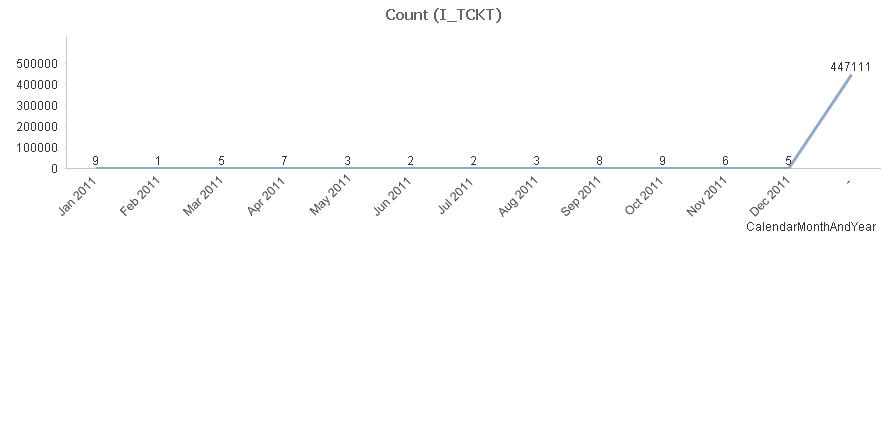
one example here is forJan/2011 chart should show 34000 tickets created but in chart it isshowing only 9 tickets,, and in 2011 year total 440000+ tickets created this count is showing excatly end of the chart.You can look this below attached screen shot so how to show month wise tickets in chart and how to write expression for this. So requesting your help on this.........
- Mark as New
- Bookmark
- Subscribe
- Mute
- Subscribe to RSS Feed
- Permalink
- Report Inappropriate Content
hi
use
month(field) as month
and can you upload your application
thanks
rohit
- Mark as New
- Bookmark
- Subscribe
- Mute
- Subscribe to RSS Feed
- Permalink
- Report Inappropriate Content
Hi rohit,
I tried in that way also but its not working......am not able to upload the sample file i created another post wit hthe same and attached the sample file there....plz check...