Unlock a world of possibilities! Login now and discover the exclusive benefits awaiting you.
- Qlik Community
- :
- All Forums
- :
- QlikView App Dev
- :
- Re: How to show data only one time in chart or tab...
- Subscribe to RSS Feed
- Mark Topic as New
- Mark Topic as Read
- Float this Topic for Current User
- Bookmark
- Subscribe
- Mute
- Printer Friendly Page
- Mark as New
- Bookmark
- Subscribe
- Mute
- Subscribe to RSS Feed
- Permalink
- Report Inappropriate Content
How to show data only one time in chart or table box?
Hi,
I have a data as below in excel file.
127662908 09/12/2014 16:46:06 09/12/2014 16:46:31 COPY
127662908 09/12/2014 16:47:01 09/12/2014 16:47:26 COPY
127662908 09/12/2014 16:47:29 09/12/2014 16:47:53 COPY
How to show in chart only one time? please can anyone help me in this.
Thanks.
- Tags:
- new_to_qlikview
- Mark as New
- Bookmark
- Subscribe
- Mute
- Subscribe to RSS Feed
- Permalink
- Report Inappropriate Content
All the times are unique, so which time do you want to show?
talk is cheap, supply exceeds demand
- Mark as New
- Bookmark
- Subscribe
- Mute
- Subscribe to RSS Feed
- Permalink
- Report Inappropriate Content
Hi,
Use Floor function in script:
Date(Floor(Date#(DateTimeField, 'DD/MM/YYYY'))) As Date
Only by date record will display and it will make one record.
- Mark as New
- Bookmark
- Subscribe
- Mute
- Subscribe to RSS Feed
- Permalink
- Report Inappropriate Content
Sorry I should have ask about below data. I have to show ID only once with start date as earliest and end date as latest
| 127662908 | 29/09/2014 | 29/09/2014 | Copy | 4 |
| 127662908 | 29/09/2014 | 29/09/2014 | Copy | 4 |
| 127662908 | 02/12/2014 | 02/12/2014 | Copy | 4 |
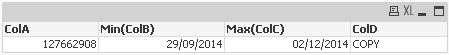
The output should be as below
127662908 29/09/2014 02/12/2014 Copy 4
please suggest me
- Mark as New
- Bookmark
- Subscribe
- Mute
- Subscribe to RSS Feed
- Permalink
- Report Inappropriate Content
As Neetha P said below, you must use the "floor" function..
It is because in QlikView dates and timestamps are in fact numbers (similar like in Excel) - when integer part of number tells about date, and fractional part tells about hour, minutes etc.
Number 1 is shown as timestamp "1899-12-31 00:00:00" (or date 1899-12-31 - depends on cel format).
Date 1900-01-01 is number 2, 1900-01-02 is number 3 and so on.
Number 3.5 represents the timestamp "1900-01-02 12:00:00", because 12:00 is in the middle between 1900-01-02 and 1900-01-03.
Number 3.75 is equal to "1900-01-02 18:00:00".
Date 2015-01-22 is in fact = 42026.
I hope you understand how it works.
Now you see, that if you use the "floor" function, you cut off the fractional part of number, which mean you cut off hours. This operation leaves you only date with "00:00:00" hour.
- Mark as New
- Bookmark
- Subscribe
- Mute
- Subscribe to RSS Feed
- Permalink
- Report Inappropriate Content
Hi,
If you try like this ways with data that you give
LOAD ColA,Date(date#(ColB,'DD/MM/YYYY'),'DD/MM/YYYY') AS ColB,
Date(date#(ColC,'DD/MM/YYYY'),'DD/MM/YYYY') as ColC,ColD;
LOAD * INLINE [
ColA, ColB, ColC, ColD
127662908, 29/09/2014, 29/09/2014, COPY
127662908, 29/09/2014, 29/09/2014, COPY
127662908, 02/12/2014, 02/12/2014, COPY
];
Dim1:- ColA
Dim2:- ColB
Expr1:- Min(B)
Expr2:- Min(C)
Regards
Anand
- Mark as New
- Bookmark
- Subscribe
- Mute
- Subscribe to RSS Feed
- Permalink
- Report Inappropriate Content
Hi Amelia,
Try below:
Data:
LOAD ID,
Status,
Date(Floor(Date#(StartDate, 'DD/MM/YYYY'))) As StartDate,
Date(Floor(Date#(EndDate, 'DD/MM/YYYY'))) As EndDate;
LOAD * Inline
[
ID,StartDate,EndDate,Status
127662908,29/09/2014 16:46:06,29/09/2014 16:46:31,COPY
127662908,29/09/2014 16:47:01,29/09/2014 16:47:26,COPY
127662908,02/12/2014 16:47:29,02/12/2014 16:47:53,COPY
127662909,29/09/2014 16:46:06,29/09/2014 16:46:31,COPY
127662909,29/09/2014 16:47:01,29/09/2014 16:47:26,COPY
127662909,02/12/2014 16:47:29,02/12/2014 16:47:53,COPY
127662910,29/09/2014 16:46:06,29/09/2014 16:46:31,COPY
127662910,29/09/2014 16:47:01,29/09/2014 16:47:26,COPY
127662910,02/12/2014 16:47:29,02/12/2014 16:47:53,COPY
];
minmax:
LOAD ID,
Status,
min(StartDate) as StartDate,
max(EndDate) as EndDate
Resident Table
Group By ID;
Drop Table Data;
Regards
Neetha
- Mark as New
- Bookmark
- Subscribe
- Mute
- Subscribe to RSS Feed
- Permalink
- Report Inappropriate Content
Even if floor would work fine to get what is requested here would I still not recommend only that approach as you will lose information that might be of interest in other calculations/objects later on. I would instead recommend to split the date and the time into two different fields - keeping all the data but makes it possible to only present the date (or time) when needed. It will also save space as it compresses better then a full time stamp.
Good luck!