Unlock a world of possibilities! Login now and discover the exclusive benefits awaiting you.
- Qlik Community
- :
- All Forums
- :
- QlikView App Dev
- :
- Re: How to show grand total in trellis chart ?
Options
- Subscribe to RSS Feed
- Mark Topic as New
- Mark Topic as Read
- Float this Topic for Current User
- Bookmark
- Subscribe
- Mute
- Printer Friendly Page
Turn on suggestions
Auto-suggest helps you quickly narrow down your search results by suggesting possible matches as you type.
Showing results for
Not applicable
2014-11-05
12:21 AM
- Mark as New
- Bookmark
- Subscribe
- Mute
- Subscribe to RSS Feed
- Permalink
- Report Inappropriate Content
How to show grand total in trellis chart ?
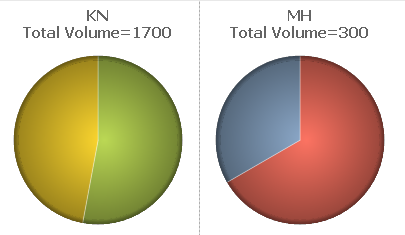
Hi, I am looking for solution to show grand total of legends in each charts shown in trellis
Sample Data:
| STATE | CITY | VOLUME |
| MH | PN | 100 |
| MH | MUM | 200 |
| KN | BN | 900 |
| KN | TN | 800 |
Output: Please see the attachment, output should have a trellis and Grand Total of legends.
811 Views
1 Solution
Accepted Solutions
Anonymous
Not applicable
2014-11-05
01:13 AM
Author
- Mark as New
- Bookmark
- Subscribe
- Mute
- Subscribe to RSS Feed
- Permalink
- Report Inappropriate Content
The best way to do this, add calculated dimension. Something like below,
=STATE&Chr(10)&'Total Volume='&Aggr(Sum(VOLUME),STATE)
2 Replies
Specialist III
2014-11-05
12:52 AM
- Mark as New
- Bookmark
- Subscribe
- Mute
- Subscribe to RSS Feed
- Permalink
- Report Inappropriate Content
Try chart properties->Presentation->Show numbers in legend(Check box)
525 Views
Anonymous
Not applicable
2014-11-05
01:13 AM
Author
- Mark as New
- Bookmark
- Subscribe
- Mute
- Subscribe to RSS Feed
- Permalink
- Report Inappropriate Content
The best way to do this, add calculated dimension. Something like below,
=STATE&Chr(10)&'Total Volume='&Aggr(Sum(VOLUME),STATE)