Unlock a world of possibilities! Login now and discover the exclusive benefits awaiting you.
- Qlik Community
- :
- All Forums
- :
- QlikView App Dev
- :
- How to show highest Risk . Part 2
- Subscribe to RSS Feed
- Mark Topic as New
- Mark Topic as Read
- Float this Topic for Current User
- Bookmark
- Subscribe
- Mute
- Printer Friendly Page
- Mark as New
- Bookmark
- Subscribe
- Mute
- Subscribe to RSS Feed
- Permalink
- Report Inappropriate Content
How to show highest Risk . Part 2
In the last question , you guys helped me with this . Luis, and other friends.
As shown in the picture. Apple belongs to different sectors but calcuation FirstSortedValue(Risk,-Level) skips some of apple. i am having this same issue.
Also i want to be able to show and divide by sectors . Later on I will be making a pie chart that shows sectors and their risk ratings based on their seller symbols.
| Seller Symbol | Sector | Risk | Level |
| Sysco | Food | High | 3 |
| Baskin Robbins | Food | Low | 1 |
| Methodist | Health | Very High | 4 |
| Dillards | Retail | Medium | 1 |
| Apple | WholeSale | High | 3 |
| Apple | Retail | Medium | 1 |
| Methodist | Food | Low | 1 |
| Methodist | Health | High | 3 |
| WWE | Retail | Medium | 1 |
| Shop N Save | Food | High | 3 |
| Kroger | Health | High | 3 |
| Hermann | Retail | Very High | 4 |
| Baskin Robbins | WholeSale | Medium | 1 |
| Methodist | Retail | High | 3 |
| Dillards | Food | Medium | 1 |
| Apple | Health | Low | 1 |
| Apple | Retail | Very High | 4 |
| Baskin Robbins | WholeSale | Medium | 1 |
| Methodist | Retail | High | 3 |
| Dillards | Health | Medium | 1 |
| Apple | Retail | Very High | 4 |
| Baskin Robbins | WholeSale | Medium | 1 |
| Methodist | Retail | High | 3 |
| Dillards | Health | Very High | 4 |
| Apple | Retail | Medium | 1 |
| Baskin Robbins | WholeSale | Very High | 4 |
| Methodist | Retail | Medium | 1 |
| Dillards | Food | High | 3 |
| Apple | Health | Medium | 1 |
| Baskin Robbins | Retail | Low | 1 |
| Methodist | WholeSale | Very High | 4 |
| Dillards | Health | Medium | 1 |
| Apple | Retail | High | 3 |
| Apple | WholeSale | Medium | 1 |
| Methodist | Retail | Low | 1 |
| Methodist | Food | High | 3 |
| Methodist | Health | Medium | 1 |
- Mark as New
- Bookmark
- Subscribe
- Mute
- Subscribe to RSS Feed
- Permalink
- Report Inappropriate Content
Hi Mike,
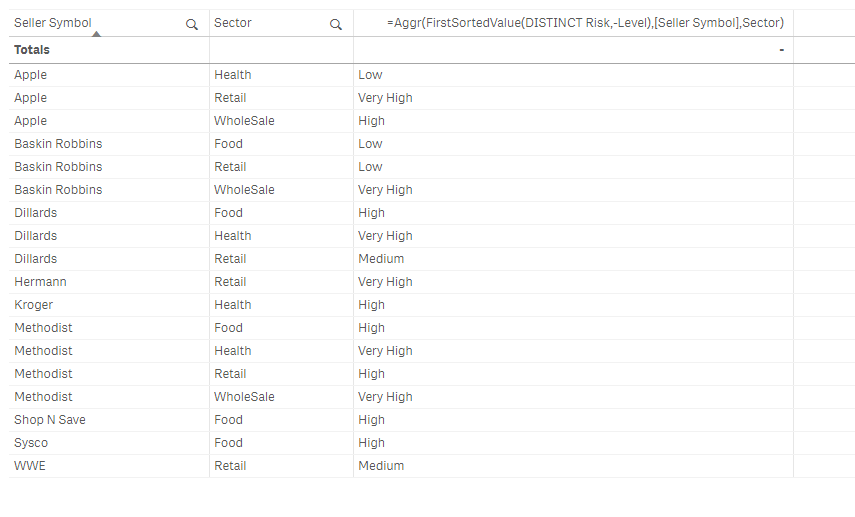
Create first two dimensions:Seller Symbol and Sector, then this dimension:
=Aggr(FirstSortedValue(DISTINCT Risk,-Level),[Seller Symbol],Sector)
Please confirm is this is what you're after in terms of the data
Cheers,
Luis
- Mark as New
- Bookmark
- Subscribe
- Mute
- Subscribe to RSS Feed
- Permalink
- Report Inappropriate Content
Hi Mike,
Try this,
Aggr(FirstSortedValue(Distinct Risk,-Pick(Match(Risk,'Low','Medium','High','Very High'),1,2,3,4)),[Seller Symbol],Sector)
- Mark as New
- Bookmark
- Subscribe
- Mute
- Subscribe to RSS Feed
- Permalink
- Report Inappropriate Content
I used the calculation. it works fine on qlik desktop but is not showing up on qlikview server.
I used this in a pie chart to be clear.
I used that calculation as a calculated dimension and for expression did a count.