Unlock a world of possibilities! Login now and discover the exclusive benefits awaiting you.
- Qlik Community
- :
- All Forums
- :
- QlikView App Dev
- :
- Re: How to show last weeks sales in a table
- Subscribe to RSS Feed
- Mark Topic as New
- Mark Topic as Read
- Float this Topic for Current User
- Bookmark
- Subscribe
- Mute
- Printer Friendly Page
- Mark as New
- Bookmark
- Subscribe
- Mute
- Subscribe to RSS Feed
- Permalink
- Report Inappropriate Content
How to show last weeks sales in a table
Hi
I am simply trying to show last weeks sales in a table for comparison.
I have a calendar table with a numeric value for week (WEEK_PAST_CALC) which counts up each week.
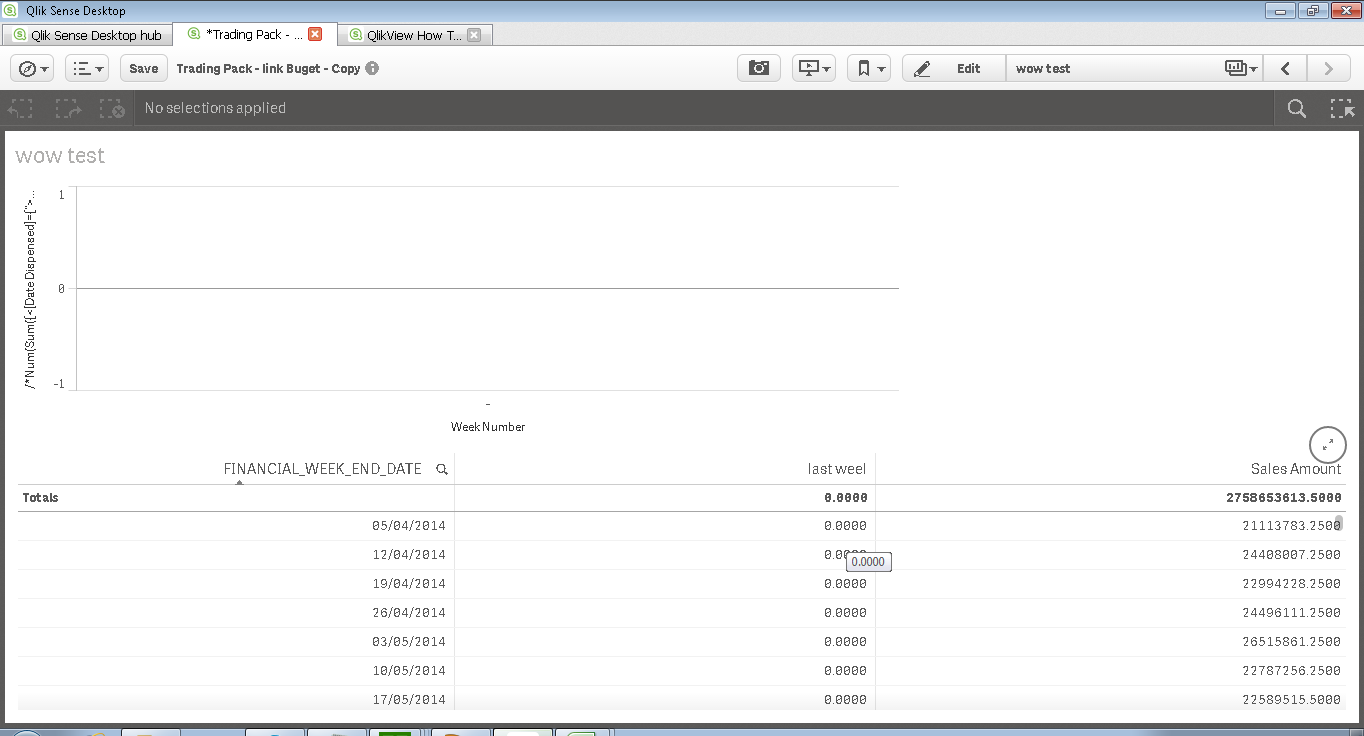
I am using the expression below but get zero and cant figure out why. Both (WEEK_PAST_CALC) and FINANCIAL_WEEK_END_DATE exist in the same table
Sum({$< WEEK_PAST_CALC = {$(=(max(WEEK_PAST_CALC)) – 1)}, FINANCIAL_WEEK_END_DATE =, Type={Sale} >} Amount)
Hope someone can give a me a steer.
Many thanks

- Tags:
- new_to_qlikview
- Mark as New
- Bookmark
- Subscribe
- Mute
- Subscribe to RSS Feed
- Permalink
- Report Inappropriate Content
You are using this expression in a chart with a date dimension. So since your expression uses a fixed calendar date range, the projection to dates outside this range is zero.
You need to add a TOTAL qualifier to overcome this:
Sum({$< WEEK_PAST_CALC = {$(=(max(WEEK_PAST_CALC)) – 1)}, FINANCIAL_WEEK_END_DATE =, Type={Sale} >} TOTAL Amount)
- Mark as New
- Bookmark
- Subscribe
- Mute
- Subscribe to RSS Feed
- Permalink
- Report Inappropriate Content
Hi swuehl,
Thanks for the immediate response, i updated as advised but still get 0 for each week. The columns in the tables are indeed FINANCIAL_WEEK_END_DATE, Sale Amount (i.e for the actual week) and the expression below which i want to return the previous weeks value. But its still Zero.
Any further suggestions would be most appreciated.
Thanks
Sum({$< WEEK_PAST_CALC = {$(=(max(WEEK_PAST_CALC)) – 1)}, FINANCIAL_WEEK_END_DATE =, FINANCIAL_YEAR =, Type={Sale} >} Total Amount)
- Mark as New
- Bookmark
- Subscribe
- Mute
- Subscribe to RSS Feed
- Permalink
- Report Inappropriate Content
Do you want to show the previous week sales looking at each dimensional value? Then set analysis won't work here anyway, since it's evaluated once per chart only.
Then you may need a chart inter record function, like above()
=Above(Sum( Amount))
If you want to calculated the sales of the previous week of max(week) in total context and show the same number in each line, you need to debug what the dollar sign expansion is returning and if this matches the format of WEEK_PAST_CALC. Both should be integer values, right?
Then you may need to clear all calendar fields the user may select in, to avoid incompatible sets, e.g. if the user may select in FINANCIAL_DATE, FINANCIAL_YEAR:
Sum({$< WEEK_PAST_CALC = {$(=(max(WEEK_PAST_CALC)) – 1)}, FINANCIAL_WEEK_END_DATE =, FINANCIAL_DATE=, FINANCIAL_YEAR=, Type={Sale} >} TOTAL Amount)
- Mark as New
- Bookmark
- Subscribe
- Mute
- Subscribe to RSS Feed
- Permalink
- Report Inappropriate Content
Thanks I do want an evaluation per dimension value and your comments help me understand that's not possible with set analysis.
I will look at what can be achieved using above.