Unlock a world of possibilities! Login now and discover the exclusive benefits awaiting you.
- Qlik Community
- :
- All Forums
- :
- QlikView App Dev
- :
- Re: How to show only the max field value in graph
- Subscribe to RSS Feed
- Mark Topic as New
- Mark Topic as Read
- Float this Topic for Current User
- Bookmark
- Subscribe
- Mute
- Printer Friendly Page
- Mark as New
- Bookmark
- Subscribe
- Mute
- Subscribe to RSS Feed
- Permalink
- Report Inappropriate Content
How to show only the max field value in graph
Hi,
I have a dimension 'Hour', a dimension 'Computer' and for each combination of them a value, 'Cpu Usage'.
Now, if I draw a bar chart with Hour as the dimension and 'max("Cpu Usage")', everything works just fine: I get the max Cpu usage for each hour. The problem is that I want to get the name of the computer that has the max Cpu usage, besides its value.
¿How can I obtain that? I've tried a trillion of different things (ranks, aggrs, firstsortedvalue....) but I can't get it.
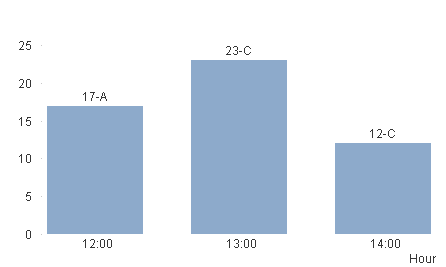
In table format, I would like something like:
Hour Computer Value
12:00 A 17
13:00 C 23
14:00 C 12
Where the value corresponds to the computer, being the max value.
Can anyone help please?
Accepted Solutions
- Mark as New
- Bookmark
- Subscribe
- Mute
- Subscribe to RSS Feed
- Permalink
- Report Inappropriate Content
Try an expression like
dual( FirstSortedValue( Computer, -Value) &': '&max(Value) , max(Value) )
- Mark as New
- Bookmark
- Subscribe
- Mute
- Subscribe to RSS Feed
- Permalink
- Report Inappropriate Content
use max({<Hour=>Value)
- Mark as New
- Bookmark
- Subscribe
- Mute
- Subscribe to RSS Feed
- Permalink
- Report Inappropriate Content
Try an expression like
dual( FirstSortedValue( Computer, -Value) &': '&max(Value) , max(Value) )
- Mark as New
- Bookmark
- Subscribe
- Mute
- Subscribe to RSS Feed
- Permalink
- Report Inappropriate Content
like this?
- Mark as New
- Bookmark
- Subscribe
- Mute
- Subscribe to RSS Feed
- Permalink
- Report Inappropriate Content
Simply way is to add one more expression as below:
Max(Value)&'-'&Computer
and uncheck the bar and check on the values on data points
- Mark as New
- Bookmark
- Subscribe
- Mute
- Subscribe to RSS Feed
- Permalink
- Report Inappropriate Content
Thank you swuehl and everyone else.
Indeed, your solutions work, although as I was afraid, I asked the wrong question. The problem was a little more complex than this 
What I wanted was to put the computer as a dimension and then show only the greatest value, as well as its min value and its average for each hour (and some more dimensions).
What I've finally done is to remove Computer as the dimension, show the max value using the FirstSortedValue, and show the min and max of that same computer using the FirstSortedValue in the Set Analysis.
Thanks!