Unlock a world of possibilities! Login now and discover the exclusive benefits awaiting you.
- Qlik Community
- :
- All Forums
- :
- QlikView App Dev
- :
- Re: How to show the accumulation expression in a g...
- Subscribe to RSS Feed
- Mark Topic as New
- Mark Topic as Read
- Float this Topic for Current User
- Bookmark
- Subscribe
- Mute
- Printer Friendly Page
- Mark as New
- Bookmark
- Subscribe
- Mute
- Subscribe to RSS Feed
- Permalink
- Report Inappropriate Content
How to show the accumulation expression in a graphic
Hi Everybody!
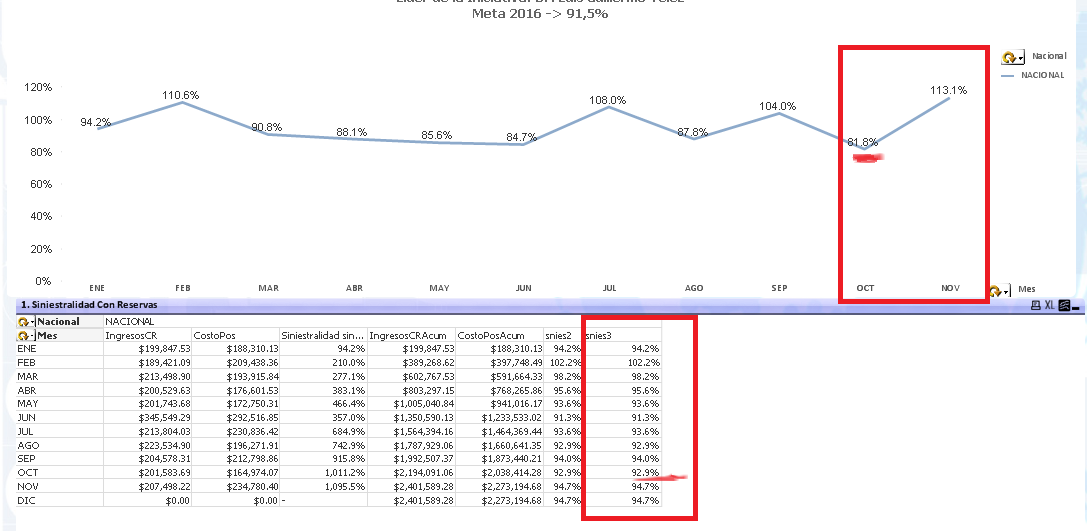
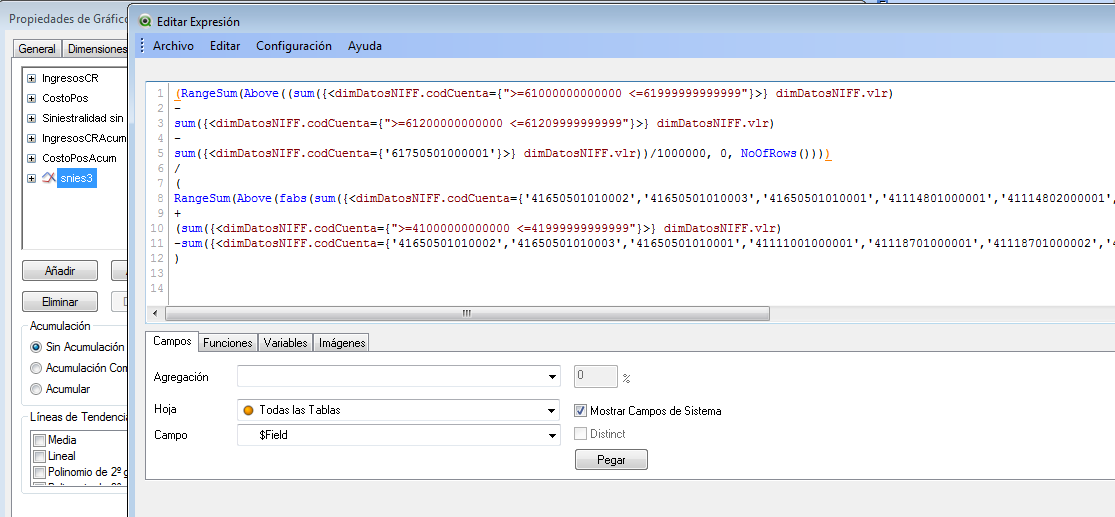
Can someone help me about this issue, I have a line graphic, with expresion to accumulate (RangeSum(Above([VENTAS], 0, NoOfRows())) ) the value is a line in the graphic is the results from division between two expressions with the function to accumulate. the problem is when the graphic shows the line it´s wrong, but when I do a quick change to pivot table the results are correct, in a simple table, it doesn´t work.
- Mark as New
- Bookmark
- Subscribe
- Mute
- Subscribe to RSS Feed
- Permalink
- Report Inappropriate Content
Can you share a sample to look at it?
- Mark as New
- Bookmark
- Subscribe
- Mute
- Subscribe to RSS Feed
- Permalink
- Report Inappropriate Content
Hi,
I think i under stood your requirement half a way,
- Are you using range sum for both of your cyclic expressions in both Line Charts and Pivot Table means the values should be same .
- If you dont want to effect two charts by your selections means use alternate states.
HTH,
Hirish
- Mark as New
- Bookmark
- Subscribe
- Mute
- Subscribe to RSS Feed
- Permalink
- Report Inappropriate Content
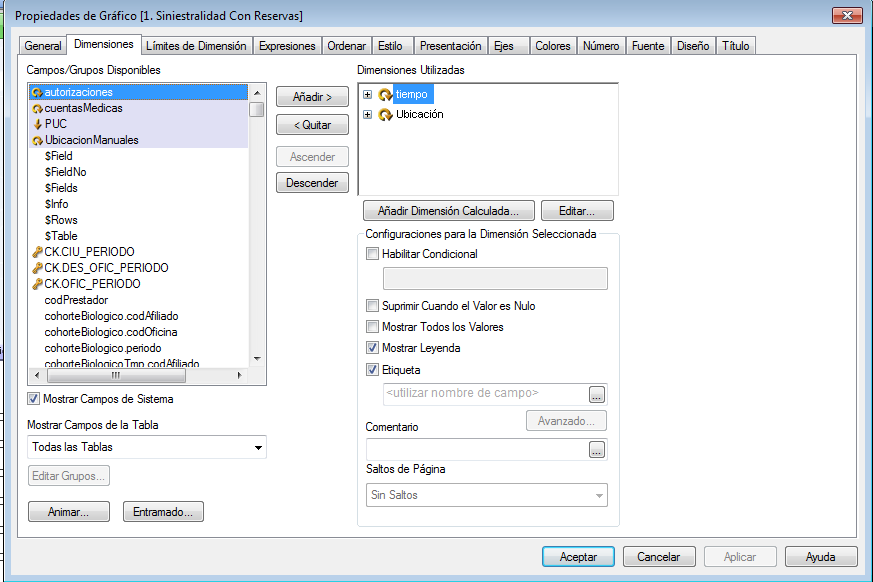
Hi, I have two dimension groups, and I have expresion that sum all values above, that means accumulative, but when I try to show in a line it doesn't show the calculate with acumulative, and the same graphic in pivot table way the calculate for "Sinies3" it's correct. I did another try, i took off ubicacion dimension, and the line shows good values, I mean it do the acumulative.
I hope I had been a little bit clearer.
- Mark as New
- Bookmark
- Subscribe
- Mute
- Subscribe to RSS Feed
- Permalink
- Report Inappropriate Content
That it could be more clear
I have two dimension groups, and I have expresion that sum all values above, that means accumulative, but when I try to show in a line it doesn't show the calculate with acumulative, and the same graphic in pivot table way the calculate for "Sinies3" it's correct. I did another try, i took off ubicacion dimension, and the line shows good values, I mean it do the acumulative.
- Mark as New
- Bookmark
- Subscribe
- Mute
- Subscribe to RSS Feed
- Permalink
- Report Inappropriate Content
Hi,
Try your Expression Like this,
This is in case your expression contains no values after a certain point it should stop,
=If(YourExpression>=1,
Rangesum(YourExpression),Above(YourExpression)))
Can u post your sample app,It will be more clear .
-Hirish
- Mark as New
- Bookmark
- Subscribe
- Mute
- Subscribe to RSS Feed
- Permalink
- Report Inappropriate Content
Hi! sorry for answering late, in attached an example
Thank you!