Unlock a world of possibilities! Login now and discover the exclusive benefits awaiting you.
- Qlik Community
- :
- All Forums
- :
- QlikView App Dev
- :
- Re: How to show the legend.
- Subscribe to RSS Feed
- Mark Topic as New
- Mark Topic as Read
- Float this Topic for Current User
- Bookmark
- Subscribe
- Mute
- Printer Friendly Page
- Mark as New
- Bookmark
- Subscribe
- Mute
- Subscribe to RSS Feed
- Permalink
- Report Inappropriate Content
How to show the legend.
Dear All.
I have a pie graphic where some itmes are so small, for that reason is not possible to see clearly the numbers, as the picture shows:
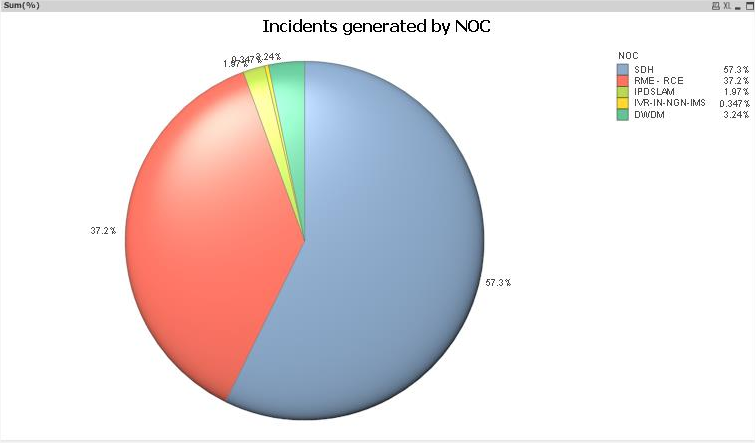
How can i configure the graphic to show the values claearly??
BR
- Mark as New
- Bookmark
- Subscribe
- Mute
- Subscribe to RSS Feed
- Permalink
- Report Inappropriate Content
change the font size in
tab font for pie
tab presentation --> settings --> font for legend
- Mark as New
- Bookmark
- Subscribe
- Mute
- Subscribe to RSS Feed
- Permalink
- Report Inappropriate Content
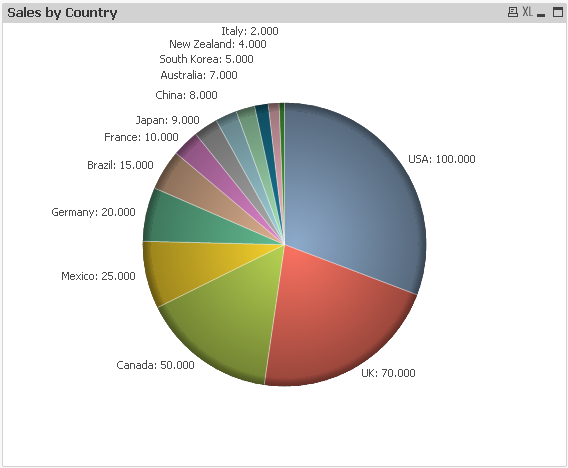
You can increase the font of legend as Massimo Grossi says and can change your expression so values don´t become so messy
Dual(
Country & ': ' &
Num(sum(Sales), '#,##0') &
Repeat(chr(13)&chr(10), rank(Sum(Sales))-7),
sum(Sales)
)
- Mark as New
- Bookmark
- Subscribe
- Mute
- Subscribe to RSS Feed
- Permalink
- Report Inappropriate Content
Hi,
If it is not compulsory to draw pie chart, you may have a look at attached document,
Popular Data Visualization - Intuitive or Unintuitive.pdf
Thanks