Unlock a world of possibilities! Login now and discover the exclusive benefits awaiting you.
- Qlik Community
- :
- All Forums
- :
- QlikView App Dev
- :
- Re: How to show y-axes label in vertical format
- Subscribe to RSS Feed
- Mark Topic as New
- Mark Topic as Read
- Float this Topic for Current User
- Bookmark
- Subscribe
- Mute
- Printer Friendly Page
- Mark as New
- Bookmark
- Subscribe
- Mute
- Subscribe to RSS Feed
- Permalink
- Report Inappropriate Content
How to show y-axes label in vertical format
Hi all,
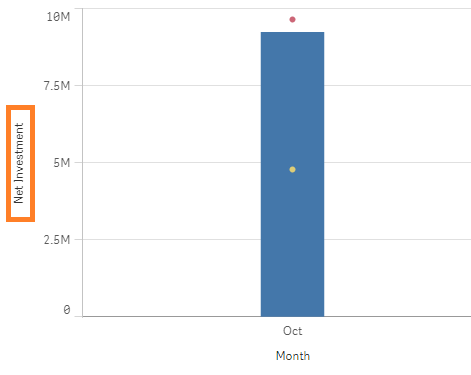
Below is a template created in Qlik Sense. However I don't know how to make it in Qlikview.

Best Regards,
Alan
- Tags:
- new_to_qlikview
Accepted Solutions
- Mark as New
- Bookmark
- Subscribe
- Mute
- Subscribe to RSS Feed
- Permalink
- Report Inappropriate Content
If you are using 'Text in Chart' option on the Presentation tab, you can use 90 degree angle:
- Mark as New
- Bookmark
- Subscribe
- Mute
- Subscribe to RSS Feed
- Permalink
- Report Inappropriate Content
If you are using 'Text in Chart' option on the Presentation tab, you can use 90 degree angle:
- Mark as New
- Bookmark
- Subscribe
- Mute
- Subscribe to RSS Feed
- Permalink
- Report Inappropriate Content
Thanks Sunny T.
However I want to add a y-axes label and show it in vertical format, not a chart label.
Best Regards,
Alan
- Mark as New
- Bookmark
- Subscribe
- Mute
- Subscribe to RSS Feed
- Permalink
- Report Inappropriate Content
Hi,
I also tried to create a text box and put it next to the y-axes scale bar as an alternative. But my difficulty is how to make it in vertical format.
Best Regards,
Alan
- Mark as New
- Bookmark
- Subscribe
- Mute
- Subscribe to RSS Feed
- Permalink
- Report Inappropriate Content
I don't see a difference. Can you check if this is what you want:
I have attached the sample for you to view as well. The only thing to note here is that you can move the Text in Chart (can be calculated expression as well) to move around to place it anywhere you want. To do that, you need to press Ctrl + Shift and you will see red lines around the text in chart. While still pressing Ctrl + Shift, move your Text in Chart to your desired location (near y-axis) and you are all set.
If this is still not what you are looking for, then please let us know.
Best,
Sunny
- Mark as New
- Bookmark
- Subscribe
- Mute
- Subscribe to RSS Feed
- Permalink
- Report Inappropriate Content
I don't think there is such thing as a Y-axis label, but the 'Text in Chart' as described by sunindia works in exactly the same way. The 'angle' option is the way to make it vertical (either 90 or -90, depending on which way you want it to face)
You can also put code, as well as text using the 'Text in Chart'.
- Mark as New
- Bookmark
- Subscribe
- Mute
- Subscribe to RSS Feed
- Permalink
- Report Inappropriate Content
Thanks Sunny, I got it.
- Mark as New
- Bookmark
- Subscribe
- Mute
- Subscribe to RSS Feed
- Permalink
- Report Inappropriate Content
Awesome ![]()