Unlock a world of possibilities! Login now and discover the exclusive benefits awaiting you.
- Qlik Community
- :
- All Forums
- :
- QlikView App Dev
- :
- Re: How to shows BEx Hierarchy in QlikView?
- Subscribe to RSS Feed
- Mark Topic as New
- Mark Topic as Read
- Float this Topic for Current User
- Bookmark
- Subscribe
- Mute
- Printer Friendly Page
- Mark as New
- Bookmark
- Subscribe
- Mute
- Subscribe to RSS Feed
- Permalink
- Report Inappropriate Content
How to shows BEx Hierarchy in QlikView?
Hi
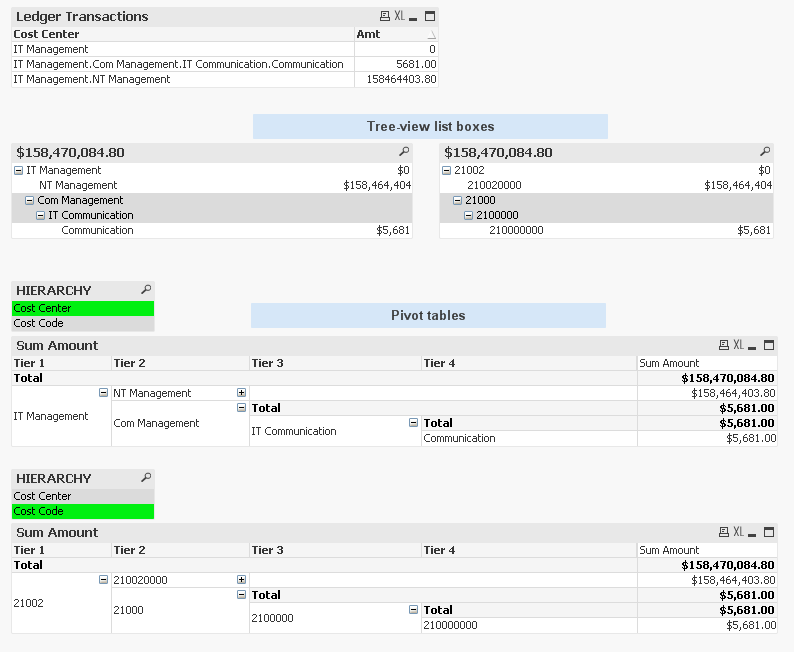
How to shows BEx Hierarchy with amount in QlikView just like it shows in BEx?
For Example:
After Loading into QlikView it shows like:
| ||||||||||||||
|---|---|---|---|---|---|---|---|---|---|---|---|---|---|---|
| ||||||||||||||
|
Waiting for reply.
- Mark as New
- Bookmark
- Subscribe
- Mute
- Subscribe to RSS Feed
- Permalink
- Report Inappropriate Content
Hello Imran,
Maybe as a starting point.. (one of things needed to know about your source data, is does it come stacked up in a vertical parent-child relationship of your cost centers, and you have to assemble the chains? Or are your hierarchies "pre-assembled" and you can just immediately begin analyzing. *Hierarchy assembly not shown here*)
[HIERARCHY]: //for dynamically swapping the pivot dimension between parallel hierarchy fields
LOAD * INLINE [
HIERARCHY
Cost Center
Cost Code
];
[FACT]:
//expenditures
LOAD *
INLINE [
Cost Center, Amt
IT Management, 0
IT Management.NT Management, 158464403.80
IT Management.Com Management.IT Communication.Communication, 5681.00
];
//A pure parent/child table would allow you to dynamically construct the parent to child bucket relationships. This table would be after that point
[COST_SEGMENT]:
LOAD * INLINE [
Cost Center, Cost Code
IT Management, 21002
IT Management.NT Management, 21002.210020000
IT Management.Com Management.IT Communication.Communication, 21002.21000.2100000.210000000
Com Management, 21002.21000
IT Communication, 21002.21000.2100000
]
WHERE Exists([Cost Center]); //don't chart cost centers that have zero activity. comment out if you want this
