Unlock a world of possibilities! Login now and discover the exclusive benefits awaiting you.
- Qlik Community
- :
- All Forums
- :
- QlikView App Dev
- :
- Re: How to stop two lines appearing on the one gra...
- Subscribe to RSS Feed
- Mark Topic as New
- Mark Topic as Read
- Float this Topic for Current User
- Bookmark
- Subscribe
- Mute
- Printer Friendly Page
- Mark as New
- Bookmark
- Subscribe
- Mute
- Subscribe to RSS Feed
- Permalink
- Report Inappropriate Content
How to stop two lines appearing on the one graph for the one calculation?
Hi,
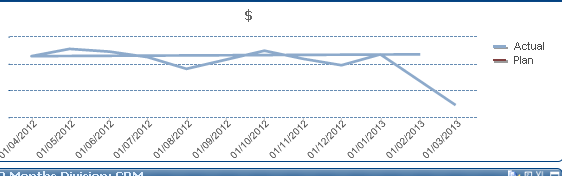
I have a line chart with sales figures for the last twelve months, calculated on a rolling period.
For example, we are now in March 2013 so the chart dates back to April 2012, and updates each month.
I have one expression, the Actual figures for the last twelve months, which is made on a variable.
The chart is now displaying two lines within the chart for the actual figure instead of one line.
See Example below;
Has anyone any idea how to fix this so that only one line appears?
- Mark as New
- Bookmark
- Subscribe
- Mute
- Subscribe to RSS Feed
- Permalink
- Report Inappropriate Content
HI,
YOU ARE SAYING YOU HAVE ONE EXPRESSION BUT IN GRAPH IT IS SHOWING TWO
LINES , IT IS IMPOSSIBLE TO HAVE LEGEND SHOWING ACTUAL,PLAN WITH ONE EXPRESSION
JUST GO AND CHECK YOUR EXPRESSION IT SEEMS YOU HAVE ADDED TWO EXPRESSION IN GRAPH.
REGARDS,
ANANT
- Mark as New
- Bookmark
- Subscribe
- Mute
- Subscribe to RSS Feed
- Permalink
- Report Inappropriate Content
Hi Anant,
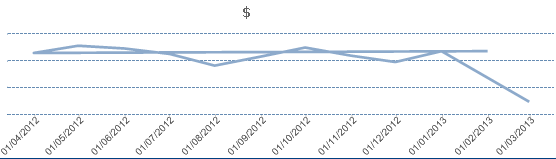
Thanks, Yes I do have another expression, but even when remove this expression i have the same problem, as you can see below.
The problem is that it is creating two lines for the one expression, the Actual figures.
Even when you highlight the ledgend for actual it highlights both of these lines.
- Mark as New
- Bookmark
- Subscribe
- Mute
- Subscribe to RSS Feed
- Permalink
- Report Inappropriate Content
Looks like you may have more than one dimension in your chart. If that's the case, try removing all but one.
talk is cheap, supply exceeds demand
- Mark as New
- Bookmark
- Subscribe
- Mute
- Subscribe to RSS Feed
- Permalink
- Report Inappropriate Content
just create a new chart add your dimension and one single expression
also if you add multiple dimnsion then it will come in your legend do .
have you added tow dimension Plan,Actual if this is the case then Gybert is correct
it will appear more than one line in chart? its up to you how many you want .
if you want one then remove that dimension.
Regards,
anant
- Mark as New
- Bookmark
- Subscribe
- Mute
- Subscribe to RSS Feed
- Permalink
- Report Inappropriate Content
I have one dimension - MonthYear
I have two expressions - Plan & Actual.
I can disable the Plan figure and I still have the same problem with the Actual. ( double lines)
What Iv done is recreate the graph from scratch and for some reason it is working now.
I still dont know why it did that,
But thank you for your help it was much appriciated.
Regards,
Sorcha