Unlock a world of possibilities! Login now and discover the exclusive benefits awaiting you.
- Qlik Community
- :
- All Forums
- :
- QlikView App Dev
- :
- Re: How to sync behavior of two bar charts (Need h...
- Subscribe to RSS Feed
- Mark Topic as New
- Mark Topic as Read
- Float this Topic for Current User
- Bookmark
- Subscribe
- Mute
- Printer Friendly Page
- Mark as New
- Bookmark
- Subscribe
- Mute
- Subscribe to RSS Feed
- Permalink
- Report Inappropriate Content
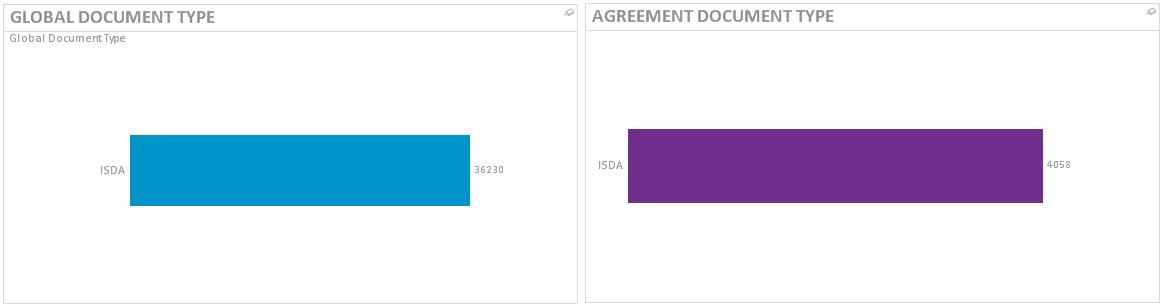
How to sync behavior of two bar charts (Need help)
I've a situation where certain behavior of two bar charts has to be achieved.
Review the bar charts seen in screen shot below.
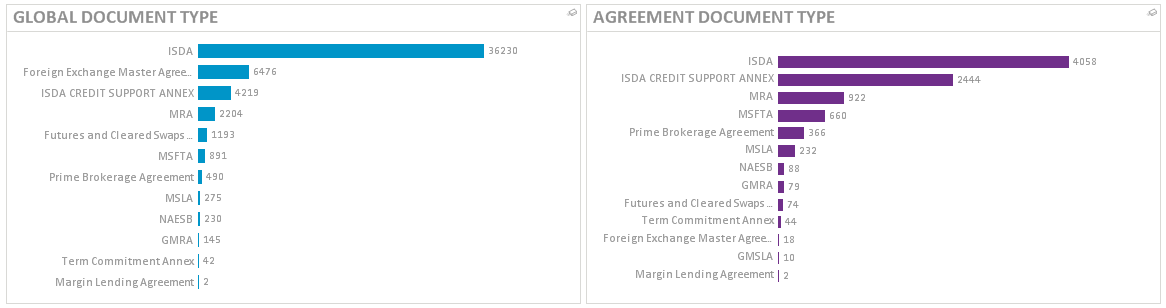
The Formula for left side (Global Document Type) chart is
=Count({<
[Document Status]={'Execution Docs Complete*'},
[Global Document Type]={'ISDA','MRA','MSFTA','GMRA','MSLA','NAESB','Foreign Exchange Master Agreement','Margin Lending Agreement','Prime Brokerage Agreement','Term Commitment Annex','Futures and Cleared Swaps Agreement','ISDA CREDIT SUPPORT ANNEX'}
>}[Counterparty Document: Document ID])
The Formula for right side (Agreement Document Type) chart is
=Count({<
[Version]={'>0'},
[Agreement Terms: Document Status]={'Execution Docs Complete*','Completed in Markit*'}
>}
[Agreement Terms: SFDC Credit Terms New number])
Now if user selects certain values in Global Document Type then Left side chart should display bars for those selected Global Document Type. Also Agreement Document Type chart on right should also display bars for selected Document Types. Currently the right side bar does display only selected document types but I'm not able to get it working for left side chart.
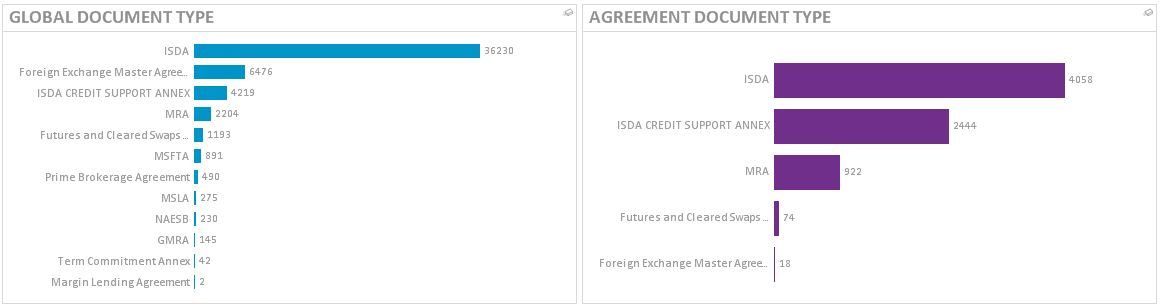
In above screenshot following Global Document Types have been selected.
Foreign Exchange Master Agreement,ISDA,ISDA CREDIT SUPPORT ANNEX,MRA,Futures and Cleared Swaps Agreement
I'm getting above values using =GetFieldSelections([Global Document Type], ',', 100)
I need following behavior to happen in above scenario instead.
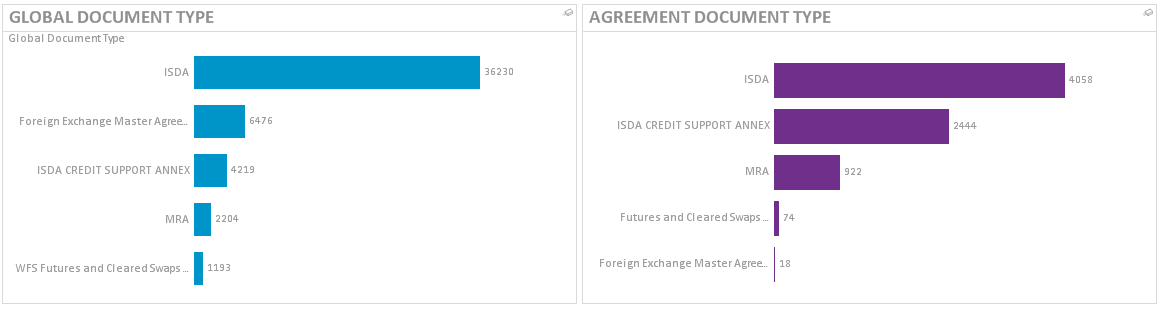
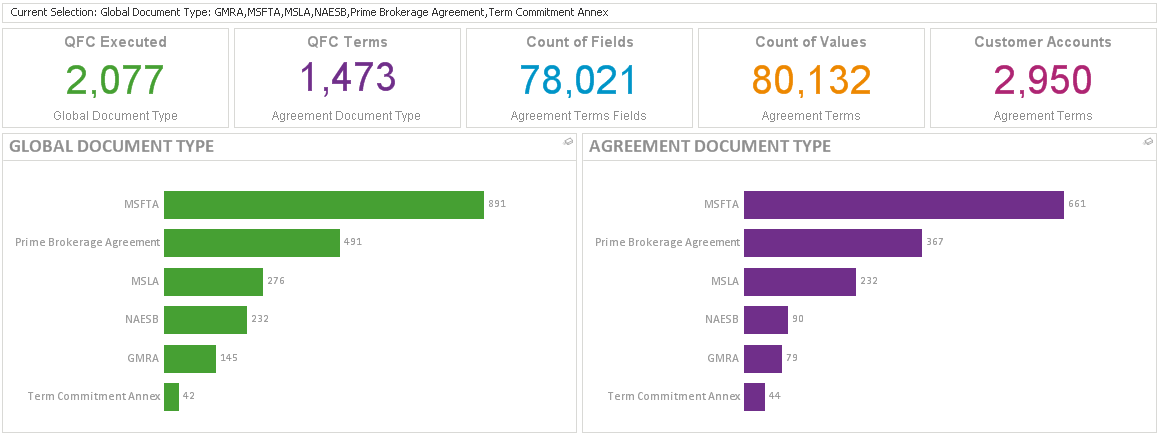
Another situation: if user selects certain values in Agreement Document Type then Left side chart should display bars for those selected Agreement Document Type but with Initial Count and not a reduced count as can be seen in screen shot below
instead it should look like below...
Any help/guidance will be great.....
Regards,
Vijay
- « Previous Replies
-
- 1
- 2
- Next Replies »
- Mark as New
- Bookmark
- Subscribe
- Mute
- Subscribe to RSS Feed
- Permalink
- Report Inappropriate Content
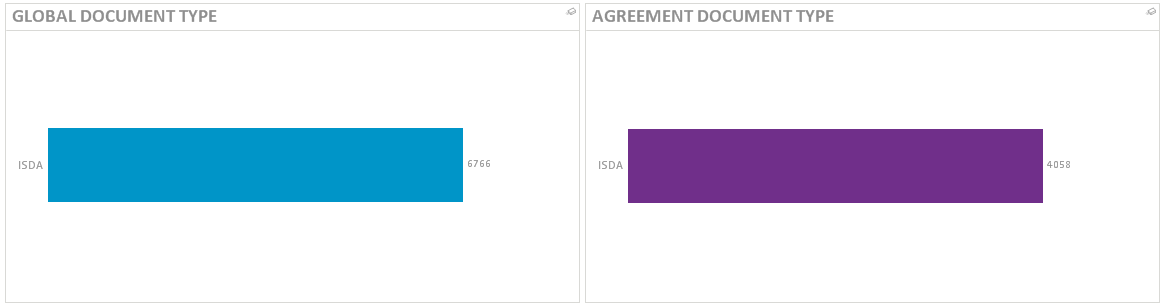
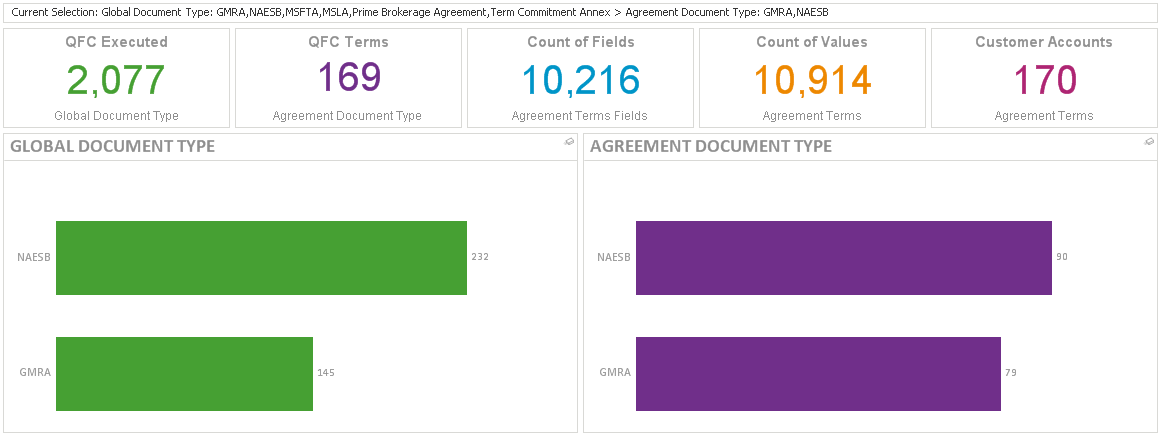
Not in this situation. If I select any values in second chart then KPI # is not getting calculated properly. If I select any values in Global Document Type then KPI# and chart behavior are fine... as can be seen in screenshots below....
ADT Selection ---- First KPI calculation not working......
- Mark as New
- Bookmark
- Subscribe
- Mute
- Subscribe to RSS Feed
- Permalink
- Report Inappropriate Content
Give this a shot
=Num(Count({<
[Document Status]={'Execution Docs Complete*'},
[Global Document Type]*={'ISDA','MRA', 'GMSLA', 'Exchange Agreement', 'Selling Guide', 'Priority Credit Line Agreement', 'General Account Agreement', 'MSFTA','GMRA','MSLA','NAESB','Foreign Exchange Master Agreement','Margin Lending Agreement','Prime Brokerage Agreement','Term Commitment Annex','WFS Futures and Cleared Swaps Agreement','ISDA CREDIT SUPPORT ANNEX'}*p([Agreement Document Type]),
[Agreement Document Type]=
>}[Counterparty Document: Document ID])
,'###,###,###')
- Mark as New
- Bookmark
- Subscribe
- Mute
- Subscribe to RSS Feed
- Permalink
- Report Inappropriate Content
Perfect..... thanks....

- Mark as New
- Bookmark
- Subscribe
- Mute
- Subscribe to RSS Feed
- Permalink
- Report Inappropriate Content
Great, remember to mark any helpful responses which you think might help future visitorsQlik Community Tip: Marking Replies as Correct or Helpful
- « Previous Replies
-
- 1
- 2
- Next Replies »