Unlock a world of possibilities! Login now and discover the exclusive benefits awaiting you.
- Qlik Community
- :
- All Forums
- :
- QlikView App Dev
- :
- Re: I need to create a seamless Time Dimension, ba...
- Subscribe to RSS Feed
- Mark Topic as New
- Mark Topic as Read
- Float this Topic for Current User
- Bookmark
- Subscribe
- Mute
- Printer Friendly Page
- Mark as New
- Bookmark
- Subscribe
- Mute
- Subscribe to RSS Feed
- Permalink
- Report Inappropriate Content
I need to create a seamless Time Dimension, based on Start Time
Hi All,
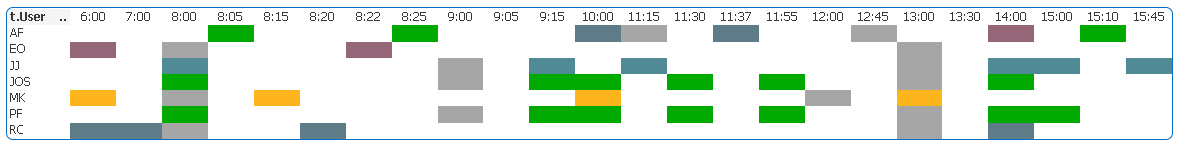
The above chart is a pivot table, The background color changes based on the task being performed
The times at the top are the start times of the task.
My question is how can I get a more seamless chart, basically I would like the chart to always have the 24 hours in a day but with the tasks colored where it fits in with the time of the day.
I hope that makes sense.
Regards
Alan
- « Previous Replies
-
- 1
- 2
- Next Replies »
- Mark as New
- Bookmark
- Subscribe
- Mute
- Subscribe to RSS Feed
- Permalink
- Report Inappropriate Content
Hi Alan,
Try to look into this by HIC.
http://community.qlik.com/blogs/qlikviewdesignblog/2013/07/23/the-master-time-table
- Mark as New
- Bookmark
- Subscribe
- Mute
- Subscribe to RSS Feed
- Permalink
- Report Inappropriate Content
This may explain it better,
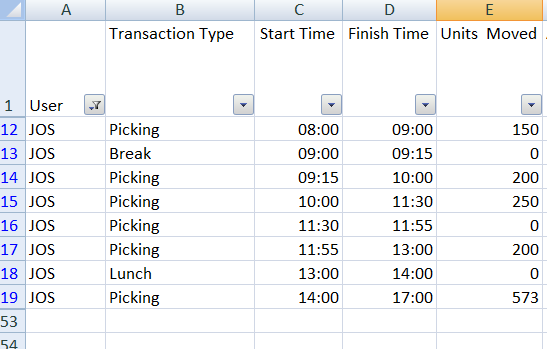
you can see from this sample data that user JOS was picking between 8 am and 9 am, but it is not represented correctly in the chart from the original post, you can see it's green for picking but only for the start time until the start time of the next task, but I need it colored from 8 to 9, like the below mock-up
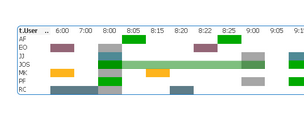
I hope that clears up what I am trying to do
Regards
Alan
- Mark as New
- Bookmark
- Subscribe
- Mute
- Subscribe to RSS Feed
- Permalink
- Report Inappropriate Content
Hi All,
Should I be using a different chart type to achieve this?
- Mark as New
- Bookmark
- Subscribe
- Mute
- Subscribe to RSS Feed
- Permalink
- Report Inappropriate Content
Alan,
Thomas is certainly right. That is perhaps the same problematic as a master calendar, but with time in a day.
Many times, the problematic is that we get an event between two dates, and this event must be "applied" to a single date (how many clients, contracts do I have a given day). Therefore, I would say:
1) create a dimension with a given time elapse : every 15 or 30 minutes
2) relate each event to this dimension (you will duplicate some lines)
3) do the chart (I did not understand the different colors, so, will you need also to split the numbers ?)
Fabrice
- Mark as New
- Bookmark
- Subscribe
- Mute
- Subscribe to RSS Feed
- Permalink
- Report Inappropriate Content
Hi,
How do I create 1 minute Intervals and link them to the Start Time and End Time?
Still not sure sorry!
Regards
Alan
- Mark as New
- Bookmark
- Subscribe
- Mute
- Subscribe to RSS Feed
- Permalink
- Report Inappropriate Content
You can use a While loop and create reference minutes, very much the same as described in http://community.qlik.com/blogs/qlikviewdesignblog/2013/02/12/reference-dates
HIC
- Mark as New
- Bookmark
- Subscribe
- Mute
- Subscribe to RSS Feed
- Permalink
- Report Inappropriate Content
Something along the following:
Load *,
Time(IntMinute/24/60) as Minute;
Load *,
StartTime_IntMin + IterNo()-1 as IntMinute
While IterNo() <= FinishTime_IntMin - StartTime_IntMin + 1 ;
Load
Floor(24*60*[Start Time]) as StartTime_IntMin,
Floor(24*60*[Finish Time]) as FinishTime_IntMin
From xxx ;
where all the fields containing 'IntMin' are integer minutes.
You would need additional code to handle intervals spanning over midnight though...
HIC
- Mark as New
- Bookmark
- Subscribe
- Mute
- Subscribe to RSS Feed
- Permalink
- Report Inappropriate Content
Alan,
Assuming StrtTime and EndTime are valid time stamps:
Data2:
LOAD ID, Start,
Timestamp(Start+IterNo()/(60*24), 'hh:mm') as NewStart,
EndTime
Resident Data
While Start+IterNo()/(60*24) <= EndTime
;
IterNo() is a function starting at 1. You can IterNo()-1 to start at 0.
A day is between 0 and 1: 0,5 is 12:00. Therefore, 1 minute is 1/60*24
The loop is done until we reach the upper bound (here End Time)
Fabrice
- Mark as New
- Bookmark
- Subscribe
- Mute
- Subscribe to RSS Feed
- Permalink
- Report Inappropriate Content
Thanks Henric,
I will try this and get back to you
Regards
Alan
- « Previous Replies
-
- 1
- 2
- Next Replies »