Unlock a world of possibilities! Login now and discover the exclusive benefits awaiting you.
- Qlik Community
- :
- All Forums
- :
- QlikView App Dev
- :
- Re: I want create a bar chart in qlikview with the...
Options
- Subscribe to RSS Feed
- Mark Topic as New
- Mark Topic as Read
- Float this Topic for Current User
- Bookmark
- Subscribe
- Mute
- Printer Friendly Page
Turn on suggestions
Auto-suggest helps you quickly narrow down your search results by suggesting possible matches as you type.
Showing results for
Creator
2017-05-31
08:48 AM
- Mark as New
- Bookmark
- Subscribe
- Mute
- Subscribe to RSS Feed
- Permalink
- Report Inappropriate Content
I want create a bar chart in qlikview with the help of excel file.
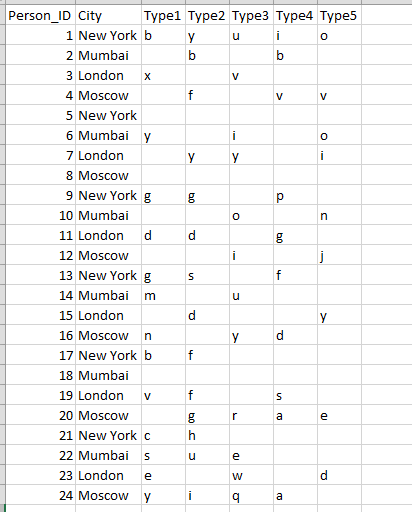
I have above data.
My requrement is - I need a bar chart with sum of counts of entries in Type1.....Type5 columns on X axis and Count of Person on Y axis.
X axis should have bars for 0 ,1,2,3,4,5
For example only one person has entries in all five type columns.so last bar will show count =1.
two perosn 20 & 24 has values in 4 columns ..so bar for 4 shoud show count 2.
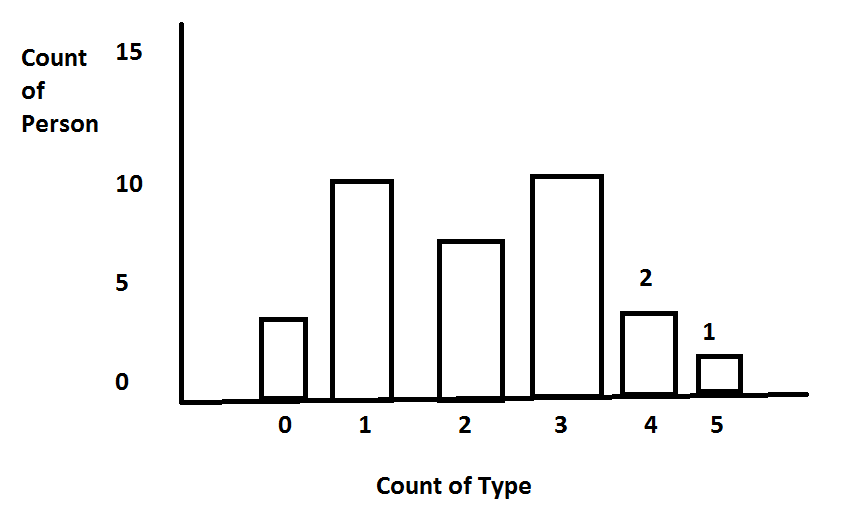
I have tried to create a expected design
425 Views
2 Replies
Anonymous
Not applicable
2017-05-31
11:39 AM
- Mark as New
- Bookmark
- Subscribe
- Mute
- Subscribe to RSS Feed
- Permalink
- Report Inappropriate Content
Hi
Please attach excel file
392 Views
2017-05-31
11:51 AM
- Mark as New
- Bookmark
- Subscribe
- Mute
- Subscribe to RSS Feed
- Permalink
- Report Inappropriate Content
May be use Force 0 for dimension level with Continuous option
Best Anil, When applicable please mark the correct/appropriate replies as "solution" (you can mark up to 3 "solutions". Please LIKE threads if the provided solution is helpful
392 Views