Unlock a world of possibilities! Login now and discover the exclusive benefits awaiting you.
- Qlik Community
- :
- All Forums
- :
- QlikView App Dev
- :
- I want the solution for my case either with set an...
- Subscribe to RSS Feed
- Mark Topic as New
- Mark Topic as Read
- Float this Topic for Current User
- Bookmark
- Subscribe
- Mute
- Printer Friendly Page
- Mark as New
- Bookmark
- Subscribe
- Mute
- Subscribe to RSS Feed
- Permalink
- Report Inappropriate Content
I want the solution for my case either with set analysis or any other suitable way
I want to calculate the aggregate sum of past 2 values + current value + next 2 values with set analysis. With or Without set analysis it works as expect.
But, when I zoom the chart we are not getting the actual result. Since I used set analysis.
I need the following,
Consider this is my data,
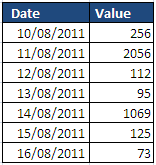
I need to plot data for `13/08/2011` would be `(2056+112+95+1069+125)` in the same we need to calculate for each date
I am trying with the following expression
It works fine: `RangeSum(Below(Sum(Value),1,3)) + RangeSum(Above(Sum(Value),1,3)) + Sum(Value)`
For zooming i used set analysis as follows,
RangeSum(Below(Sum({<Date=>}Value),1,3)) + RangeSum(Above(Sum({<Date=>}Value),1,3)) + Sum({<Date=>}Value)
Not working as expect. Please help me to get rid of this.
- Mark as New
- Bookmark
- Subscribe
- Mute
- Subscribe to RSS Feed
- Permalink
- Report Inappropriate Content
It's probably easiest to create an AsOf table that links every date with the interval -2 to +2 days:
AsOfDate, Date
...
12/08/2011, 10/08/2011
12/08/2011, 11/08/2011
12/08/2011, 12/08/2011
12/08/2011, 13/08/2011
12/08/2011, 14/08/2011
13/08/2011, 11/08/2011
13/08/2011, 12/08/2011
13/08/2011, 13/08/2011
13/08/2011, 14/08/2011
13/08/2011, 15/08/2011
...etc
See this document for more information: Calculating rolling n-period totals, averages or other aggregations
talk is cheap, supply exceeds demand