Unlock a world of possibilities! Login now and discover the exclusive benefits awaiting you.
- Qlik Community
- :
- All Forums
- :
- QlikView App Dev
- :
- Re: I worked on guage chart.But I am not getting t...
- Subscribe to RSS Feed
- Mark Topic as New
- Mark Topic as Read
- Float this Topic for Current User
- Bookmark
- Subscribe
- Mute
- Printer Friendly Page
- Mark as New
- Bookmark
- Subscribe
- Mute
- Subscribe to RSS Feed
- Permalink
- Report Inappropriate Content
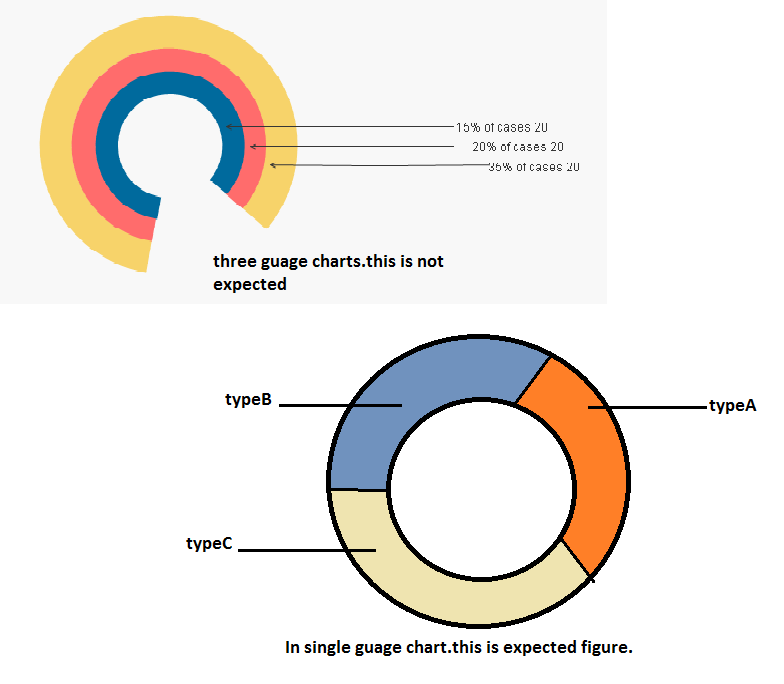
I worked on guage chart.But I am not getting thing that what I expected?
- Tags:
- qlikview_scripting
- Mark as New
- Bookmark
- Subscribe
- Mute
- Subscribe to RSS Feed
- Permalink
- Report Inappropriate Content
can you send the sample qvw?
- Mark as New
- Bookmark
- Subscribe
- Mute
- Subscribe to RSS Feed
- Permalink
- Report Inappropriate Content
A gauge chart is not what you need. Gauges only return a single value.
You need a donut styled piechart.
- Mark as New
- Bookmark
- Subscribe
- Mute
- Subscribe to RSS Feed
- Permalink
- Report Inappropriate Content
PFA Samples.
Vikas
If the issue is solved please mark the answer with Accept as Solution & like it.
If you want to go quickly, go alone. If you want to go far, go together.
- Mark as New
- Bookmark
- Subscribe
- Mute
- Subscribe to RSS Feed
- Permalink
- Report Inappropriate Content
While Jonathan is correct a gauge chart only returns a single value there are exceptions.
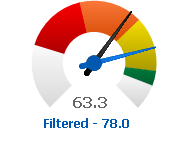
This is actually 2 gauge charts one overlaying the other and there are lots of values that are being shown.
This is actually for Quartiles so you can see the ranges for the quartiles - they all have the same number of values within them but the green Quartile 1 is a very small range 86-90 because all of the values for the 1st Quartile fit int that range 86-90.
You can you calculate the segments and therefore the segment can give additional values.
You can also put in different reference lines or do something different with overlaying gauges maybe hide the needle but display the value (in mine Filtered - 78.0 is a separate text box).
Just some food for thought.
- Mark as New
- Bookmark
- Subscribe
- Mute
- Subscribe to RSS Feed
- Permalink
- Report Inappropriate Content
Hi,
Please check the guage chart example in KPI sheet in the attached file. Hope this will help you.
- Mark as New
- Bookmark
- Subscribe
- Mute
- Subscribe to RSS Feed
- Permalink
- Report Inappropriate Content
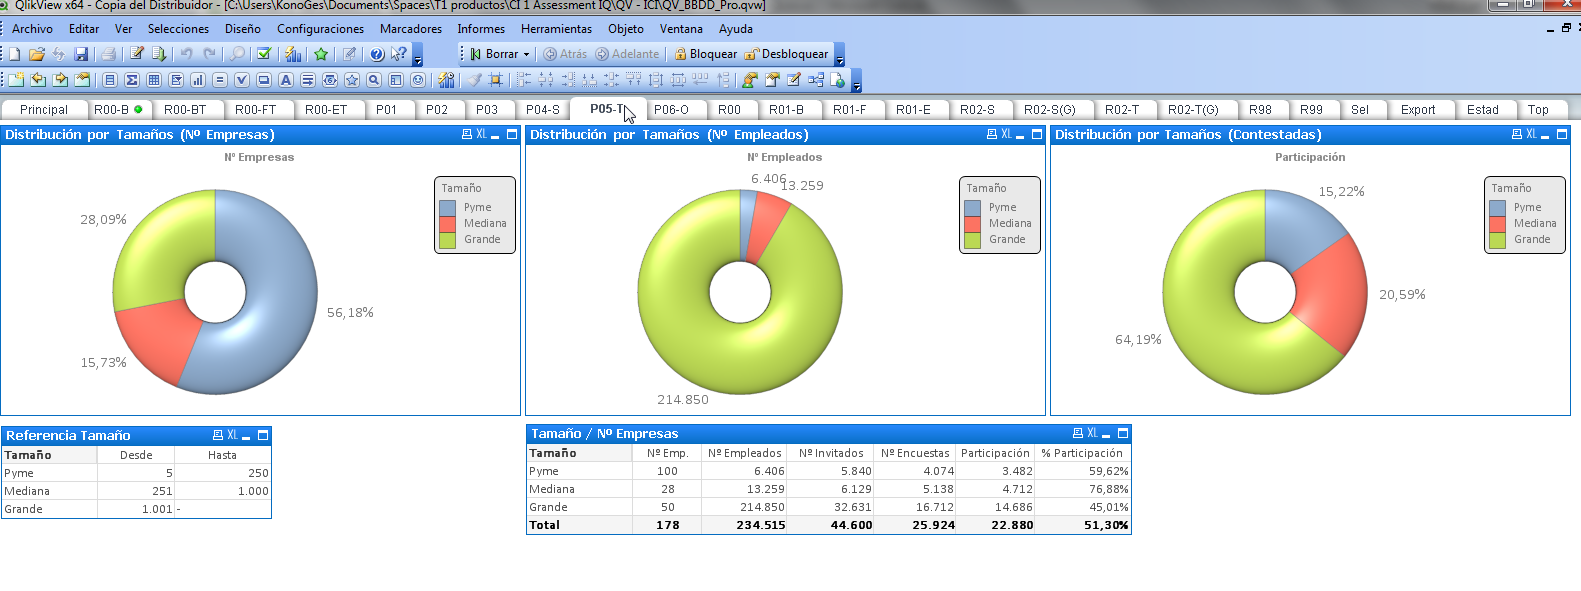
Select a Graphic type PIE and style Donut
- Mark as New
- Bookmark
- Subscribe
- Mute
- Subscribe to RSS Feed
- Permalink
- Report Inappropriate Content
please provide some link
- Mark as New
- Bookmark
- Subscribe
- Mute
- Subscribe to RSS Feed
- Permalink
- Report Inappropriate Content
Its correct.buyt I want in single guage chart .is it possible or not?
- Mark as New
- Bookmark
- Subscribe
- Mute
- Subscribe to RSS Feed
- Permalink
- Report Inappropriate Content
 see this