Unlock a world of possibilities! Login now and discover the exclusive benefits awaiting you.
- Qlik Community
- :
- All Forums
- :
- QlikView App Dev
- :
- Re: IF and COUNT - need some help on this
- Subscribe to RSS Feed
- Mark Topic as New
- Mark Topic as Read
- Float this Topic for Current User
- Bookmark
- Subscribe
- Mute
- Printer Friendly Page
- Mark as New
- Bookmark
- Subscribe
- Mute
- Subscribe to RSS Feed
- Permalink
- Report Inappropriate Content
IF and COUNT - need some help on this
Hello,
Can someone explain to me what exactly this line mean in QV?
= If((((count({<col1-={'payment'}, col2 = {'$(=max(col2))'}, _YTD = {'YTD'}>} col1)) / (count({<col1-={'payment'}, col2 = {'$(=max(col2)-1)'},_YTD = {'YTD'}>} col1)))-1)
>
0,
chr(9650),chr(9660))
I think ultimately it evaluates the expression to if > 0, then generate 9650 else 9660. But I need to explain in plain English
especially what that "-1" mean before the "> 0" on the 2nd line in above.
Thanks!
- Tags:
- new_to_qlikview
- « Previous Replies
-
- 1
- 2
- Next Replies »
- Mark as New
- Bookmark
- Subscribe
- Mute
- Subscribe to RSS Feed
- Permalink
- Report Inappropriate Content
what's col2?
thinking of col2 as year it seems a count(curryear / prevyear -1); so, if count of col1 this year is > of count prev year,
chr(9650)
Geometric Shapes - Wikipedia, the free encyclopedia
= If(
(
(
(count({<col1-={'payment'}, col2 = {'$(=max(col2))'}, _YTD = {'YTD'}>} col1) )
/
(count({<col1-={'payment'}, col2 = {'$(=max(col2)-1)'},_YTD = {'YTD'}>} col1) )
)
-1)
>
0,
chr(9650),chr(9660)
)
- Mark as New
- Bookmark
- Subscribe
- Mute
- Subscribe to RSS Feed
- Permalink
- Report Inappropriate Content
maxgro has the correct answer.
The -1 at the end is just subtracting one from your current year over previous year calculation.
- Mark as New
- Bookmark
- Subscribe
- Mute
- Subscribe to RSS Feed
- Permalink
- Report Inappropriate Content
maxgro,
Yes, col2 is the year.
I can see the "-1" in this line
(count({<col1-={'payment'}, col2 = {'$(=max(col2)-1)'},_YTD = {'YTD'}>} col1) )
means subtracting the year by 1.
But what about this "-1" as in
-1)
>
0,
chr(9650),chr(9660)
)
That's what I was asking in my original post?
Also I would assume the chr(9960) is a red down pointing triangle since I only black or red on the screen.
Thanks
- Mark as New
- Bookmark
- Subscribe
- Mute
- Subscribe to RSS Feed
- Permalink
- Report Inappropriate Content
It is taking one away from the count of this year over the count of last year.
(Count This Year/Count Previous Year) - 1
I am not exactly sure why they are doing it this way. I think it is just a way to find out of the count the previous year is higher/lower than the current (or max) year. Maybe someone can explain the rational of doing it this way.
Basically if the count this year is higher than last year, the quotient will be greater than 1, so when you subtract 1, you get a number more than zero.
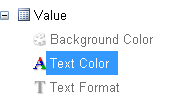
I don't think the up and down arrows have color unless they were assigned colors another way (Text color in the expression?)
Like if(Value=chr(9660),Red(),Black())
- Mark as New
- Bookmark
- Subscribe
- Mute
- Subscribe to RSS Feed
- Permalink
- Report Inappropriate Content
- Mark as New
- Bookmark
- Subscribe
- Mute
- Subscribe to RSS Feed
- Permalink
- Report Inappropriate Content
This is what I was trying to do.
I was trying to change the color of the up/down arrow based on the value. If the value is negative, show
a green down arrow. If the value is positive, show a red up arrow. See the screenshot attached and specifically
the values inside in the red box in Fig1. The top number is a text object while the red box is a chart of
straight table. This chart object contains two expressions and they are not being labeled (blanks).
The screenshot I attached here contains three figures (Fig1, Fig2 and Fig3). Fig2 is EXP1. Since 3.14% is positive, I
want to show a RED up arrow. So I entered the Upper and Lower values and change the colors to reflect what I want.
This is all shown in Fig2. So I clicked "Apply" on the screen. But the black up arrow remain unchanged and it still
shows up as in Fig1. Fig3 is just to show you the other expression.
How do I change the color of this pointing up/down arrows??
![]()
// EXP1
= If(
(
(
(
sum({<expense={'1'}, fYear = {'$(=max(fYear))'},_YTD = {'YTD'}>}amount)
)
/
(
sum({<expense={'1'}, fYear = {'$(=max(fYear)-1)'},_YTD = {'YTD'}>}amount)
)
)
-1
)
>
0,
chr(9650),chr(9660))
// EXP1
=
(
(
sum({<expense={'1'}, fYear = {'$(=max(fYear))'},_YTD = {'YTD'}>}amount)
)
/
(
sum({<expense={'1'}, fYear = {'$(=max(fYear)-1)'},_YTD = {'YTD'}>}amount)
)
)
-1
- Mark as New
- Bookmark
- Subscribe
- Mute
- Subscribe to RSS Feed
- Permalink
- Report Inappropriate Content
Sorry after I posted my reply, part of my screenshot got truncated. Going from top to bottom. First image is Fig1, then
Fig2 and Fig3.
- Mark as New
- Bookmark
- Subscribe
- Mute
- Subscribe to RSS Feed
- Permalink
- Report Inappropriate Content
Better use an IF-THEN-ELSE construct in your expression. If necessary, use a straight table without dimensions, because a straight table allows your to present an expression result as an image.
In the expression formula dialog, select the "Images" tab at the bottom, select Image Folder <Bundled / Buitlin > and look for a colored arrow picture you like. (ex. arrow_s_r.png for a red arrow pointing down).
Do not forget to set "Representation" to "Image" in the Expression tab, or the arrow file name will be printed as text instead of a picture...
Best,
Peter
- Mark as New
- Bookmark
- Subscribe
- Mute
- Subscribe to RSS Feed
- Permalink
- Report Inappropriate Content
Peter,
I followed your instructions:
In the expression formula dialog, select the "Images" tab at the bottom, select Imae Folder <Bundled / Buitlin > and look for a colored picutre you like. (ex. arrow_s_r.png for a red arrow pointing down).
Do not forget to set "Representation" to "Image" in the Expression tab,
The black up arrow still shows up when is 3.14% in my Fig1.
QV development is all new to me. If you don't mind, would you re-compose the expression to use IF-THEN-ELSE construct in QV so I can take a look? I'm not new to programming but I'm new to QV. I can follow logic.
Thanks much.
- « Previous Replies
-
- 1
- 2
- Next Replies »