Unlock a world of possibilities! Login now and discover the exclusive benefits awaiting you.
- Qlik Community
- :
- All Forums
- :
- QlikView App Dev
- :
- Implementing scatter charts with google maps
- Subscribe to RSS Feed
- Mark Topic as New
- Mark Topic as Read
- Float this Topic for Current User
- Bookmark
- Subscribe
- Mute
- Printer Friendly Page
- Mark as New
- Bookmark
- Subscribe
- Mute
- Subscribe to RSS Feed
- Permalink
- Report Inappropriate Content
Implementing scatter charts with google maps
Hi All,
I am trying to implement a scatter chart but am confused with what should be marked as a dimension and what should be kept as an expression for bubble size.
The sample set has a brand name and a count column in addition to other data. I was separate bubbles for each products and for the bubble size, I want the sum of all counts of the specific project.
Since I need to implement a google map, I have kept the first two expressions for Latitude and Longitude.
However, I am not able to implement the scatter chart.
Please help.
- Mark as New
- Bookmark
- Subscribe
- Mute
- Subscribe to RSS Feed
- Permalink
- Report Inappropriate Content
Pfa Scatter Chart with Google Map
Vikas
If the issue is solved please mark the answer with Accept as Solution & like it.
If you want to go quickly, go alone. If you want to go far, go together.
- Mark as New
- Bookmark
- Subscribe
- Mute
- Subscribe to RSS Feed
- Permalink
- Report Inappropriate Content
Hi Vikas,
Thanks a lot for the reply.
However, I am facing a strange error. The map is visible all right but the scatter points are missing. Could yu think of any plausible scenario to account for this?
Regards,
Ravleen Kaur
- Mark as New
- Bookmark
- Subscribe
- Mute
- Subscribe to RSS Feed
- Permalink
- Report Inappropriate Content
Request you to attach Dummy or demo sample of your qvw and try to copy the script from Google_map_sample_1.qvw in this chart I have create Static Map using Image you can make this Dynamic as per lati and logi scatter chart will show the co-ordinates some time key have some problem.
Good Luck
Thanks
Vikas
If the issue is solved please mark the answer with Accept as Solution & like it.
If you want to go quickly, go alone. If you want to go far, go together.
- Mark as New
- Bookmark
- Subscribe
- Mute
- Subscribe to RSS Feed
- Permalink
- Report Inappropriate Content
Check color in Properties->Colors tab of scatter chart.
Possible reason coluld be, color of scatter points is somewhat similar to that of map.
- Mark as New
- Bookmark
- Subscribe
- Mute
- Subscribe to RSS Feed
- Permalink
- Report Inappropriate Content
its very easy upload qvw file.
- Mark as New
- Bookmark
- Subscribe
- Mute
- Subscribe to RSS Feed
- Permalink
- Report Inappropriate Content
- Mark as New
- Bookmark
- Subscribe
- Mute
- Subscribe to RSS Feed
- Permalink
- Report Inappropriate Content
Hi Vikas,
Thanks a lot for the reply.
I could resolve the error behind the missing scatter points but now the points are being displayed with an offset.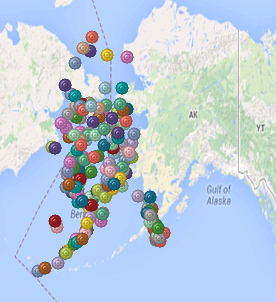
Any idea why that would be happening?
- Mark as New
- Bookmark
- Subscribe
- Mute
- Subscribe to RSS Feed
- Permalink
- Report Inappropriate Content
Please attach a sample
If the issue is solved please mark the answer with Accept as Solution & like it.
If you want to go quickly, go alone. If you want to go far, go together.
- Mark as New
- Bookmark
- Subscribe
- Mute
- Subscribe to RSS Feed
- Permalink
- Report Inappropriate Content
I am trying to add expressions to the chart, but i can't select bar and symbol for my 1st 2 expressions? Anyone faced this problem?