Unlock a world of possibilities! Login now and discover the exclusive benefits awaiting you.
- Qlik Community
- :
- All Forums
- :
- QlikView App Dev
- :
- Re: In Pivot table, How to fabs firstly then sum
- Subscribe to RSS Feed
- Mark Topic as New
- Mark Topic as Read
- Float this Topic for Current User
- Bookmark
- Subscribe
- Mute
- Printer Friendly Page
- Mark as New
- Bookmark
- Subscribe
- Mute
- Subscribe to RSS Feed
- Permalink
- Report Inappropriate Content
In Pivot table, How to fabs firstly then sum
Hi, Guys
I met a big problem on ABS function
I need to get the final result is sum all the item absloute deviation
for example
| item | Forecast | Demand |
|---|---|---|
| a | 10 | 12 |
| b | 10 | 8 |
| c | 10 | 10 |
The correct anwser is |10-12|+|10-8|+|10-10| = 4
not |10+10+10 - 12-8-10| = 0
From my previous experience, I create a temp table to store each absloute deviation, the put them in the pivot table
However, the new case is the Demand is composed of three kinds of Demand
Take first row 12 as example, 12 comes from 8(current)+4 (future) + 0 (old)
The user want to add a filter to customize the real Demand (8+4 or 8 lonely)
Then how do I create the temp table to calculate each independent absloute deviation to suit for the filter?
- « Previous Replies
-
- 1
- 2
- Next Replies »
Accepted Solutions
- Mark as New
- Bookmark
- Subscribe
- Mute
- Subscribe to RSS Feed
- Permalink
- Report Inappropriate Content
May be something like this;
Sum(Fabs(RangeSum(Forecast, Demand))) or
Sum(Aggr(Fabs(RangeSum(Forecast, Demand)), Item))
Sum(Fabs(RangeSum(Forecast, -Demand))) or
Sum(Aggr(Fabs(RangeSum(Forecast, -Demand)), Item))
- Mark as New
- Bookmark
- Subscribe
- Mute
- Subscribe to RSS Feed
- Permalink
- Report Inappropriate Content
if Forecast and Demand are two expression in your chart, then use 3rd expression like:
Forecast - Demand //Expression label name, you can use abs() as well
- Mark as New
- Bookmark
- Subscribe
- Mute
- Subscribe to RSS Feed
- Permalink
- Report Inappropriate Content
May be something like this;
Sum(Fabs(RangeSum(Forecast, Demand))) or
Sum(Aggr(Fabs(RangeSum(Forecast, Demand)), Item))
Sum(Fabs(RangeSum(Forecast, -Demand))) or
Sum(Aggr(Fabs(RangeSum(Forecast, -Demand)), Item))
- Mark as New
- Bookmark
- Subscribe
- Mute
- Subscribe to RSS Feed
- Permalink
- Report Inappropriate Content
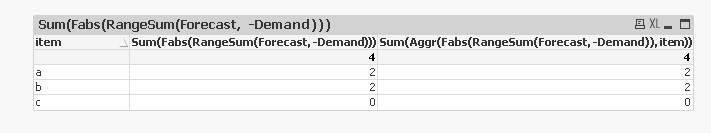
in item level it worked
but if in higher level, the summary will sum first then abs
- Mark as New
- Bookmark
- Subscribe
- Mute
- Subscribe to RSS Feed
- Permalink
- Report Inappropriate Content
Hi,
You can use this as your expression
sum(aggr(fabs(Forecast-Demand),Item))
Hope this help
Regards,
Marco
- Mark as New
- Bookmark
- Subscribe
- Mute
- Subscribe to RSS Feed
- Permalink
- Report Inappropriate Content
Hi,
You can try using Aggr() like below
=Sum(Aggr(Fabs(Forecast-Demand), item))
OR the best thing is calculate in the script itself
LOAD
*,
Forecast - Demand AS ForecastDiff
FROM DataSource;
Now you can straight away use
=Sum(ForecastDiff)
Note: If data is huge Aggr() will have performance issues.
Hope this helps you.
Regards,
Jagan.
- Mark as New
- Bookmark
- Subscribe
- Mute
- Subscribe to RSS Feed
- Permalink
- Report Inappropriate Content
Hi,
did you try simple expression like
sum(fabs(Forecast-Demand))
This will work.
Regards
Please appreciate our Qlik community members by giving Kudos for sharing their time for your query. If your query is answered, please mark the topic as resolved 🙂
- Mark as New
- Bookmark
- Subscribe
- Mute
- Subscribe to RSS Feed
- Permalink
- Report Inappropriate Content
Thanks for your guys anwser, the total amount will be aggrated on the top by the straight table
But in addition, if i want to display in month level ,for example
201505 2
201506 4
In pivot table it may expand to monthly item level, but here we knows must use straight table , so how to display the month level abs?
I need a chart to describe the monthly trend, so i need each month point abs first then sum
- Mark as New
- Bookmark
- Subscribe
- Mute
- Subscribe to RSS Feed
- Permalink
- Report Inappropriate Content
Thanks for your guys anwser, the total amount will be aggrated on the top by the straight table
But in addition, if i want to display in month level ,for example
201505 2
201506 4
In pivot table it may expand to monthly item level, but here we knows must use straight table , so how to display the month level abs?
I need a chart to describe the monthly trend, so i need each month point abs first then sum chooco_co
- Mark as New
- Bookmark
- Subscribe
- Mute
- Subscribe to RSS Feed
- Permalink
- Report Inappropriate Content
Hi Jarven,,
Can you share your simple data and your expected result so we can help you.
Thanks
- « Previous Replies
-
- 1
- 2
- Next Replies »