Unlock a world of possibilities! Login now and discover the exclusive benefits awaiting you.
Announcements
SYSTEM MAINTENANCE: Thurs., Sept. 19, 1 AM ET, Platform will be unavailable for approx. 60 minutes.
- Qlik Community
- :
- All Forums
- :
- QlikView App Dev
- :
- Re: In a combo chart, is there a way to show the t...
Options
- Subscribe to RSS Feed
- Mark Topic as New
- Mark Topic as Read
- Float this Topic for Current User
- Bookmark
- Subscribe
- Mute
- Printer Friendly Page
Turn on suggestions
Auto-suggest helps you quickly narrow down your search results by suggesting possible matches as you type.
Showing results for
Anonymous
Not applicable
2012-11-13
09:02 AM
- Mark as New
- Bookmark
- Subscribe
- Mute
- Subscribe to RSS Feed
- Permalink
- Report Inappropriate Content
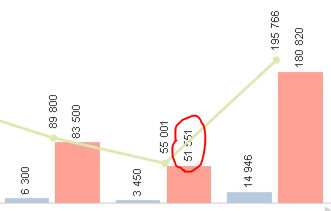
In a combo chart, is there a way to show the text from a bar chart on top of the line graph?
I have a combo chart, and sometimes the values from the bar chart are overlapped by the line graph.
Is there a way to set the values so they appear over and not under the line graph?
666 Views
4 Replies
MVP
2012-11-13
09:06 AM
- Mark as New
- Bookmark
- Subscribe
- Mute
- Subscribe to RSS Feed
- Permalink
- Report Inappropriate Content
Hi,
Can you provide any snapo shot of the problem.
Regards,
Anand
525 Views
Anonymous
Not applicable
2012-11-13
09:09 AM
Author
- Mark as New
- Bookmark
- Subscribe
- Mute
- Subscribe to RSS Feed
- Permalink
- Report Inappropriate Content
Hi Anand,
Here is an example:
525 Views
Not applicable
2012-11-13
09:11 AM
Author
- Mark as New
- Bookmark
- Subscribe
- Mute
- Subscribe to RSS Feed
- Permalink
- Report Inappropriate Content
Exaple you have a BarChart
in exspression do you use function dual:
dual('Tot DataSales '&chr(13)& num(sum(Sales),'#.##0'), sum(sales))
Then you cheak th option Values on Data Points
525 Views
MVP
2012-11-13
09:13 AM
- Mark as New
- Bookmark
- Subscribe
- Mute
- Subscribe to RSS Feed
- Permalink
- Report Inappropriate Content
Hi,
I suggest you have to reduce some space between the bar by reducing the spaces then your value looks good.
HTH
Regards,
Anand
525 Views