Unlock a world of possibilities! Login now and discover the exclusive benefits awaiting you.
- Qlik Community
- :
- All Forums
- :
- QlikView App Dev
- :
- Re: In a grid chart, show negative values as red?
- Subscribe to RSS Feed
- Mark Topic as New
- Mark Topic as Read
- Float this Topic for Current User
- Bookmark
- Subscribe
- Mute
- Printer Friendly Page
- Mark as New
- Bookmark
- Subscribe
- Mute
- Subscribe to RSS Feed
- Permalink
- Report Inappropriate Content
In a grid chart, show negative values as red?
Hello,
I would like to in my grid chart show positive values in green and negative values in red.
My values are in percentages.
So far I have been able to make them green for positive, but the negative values won't show up at all.
I entered this formula into the expression background color definition:
If(Avg(Growth)<0,RGB(Avg(Growth)=255,0,0),RGB(Avg(Growth)=0,128,0))
and I get this:
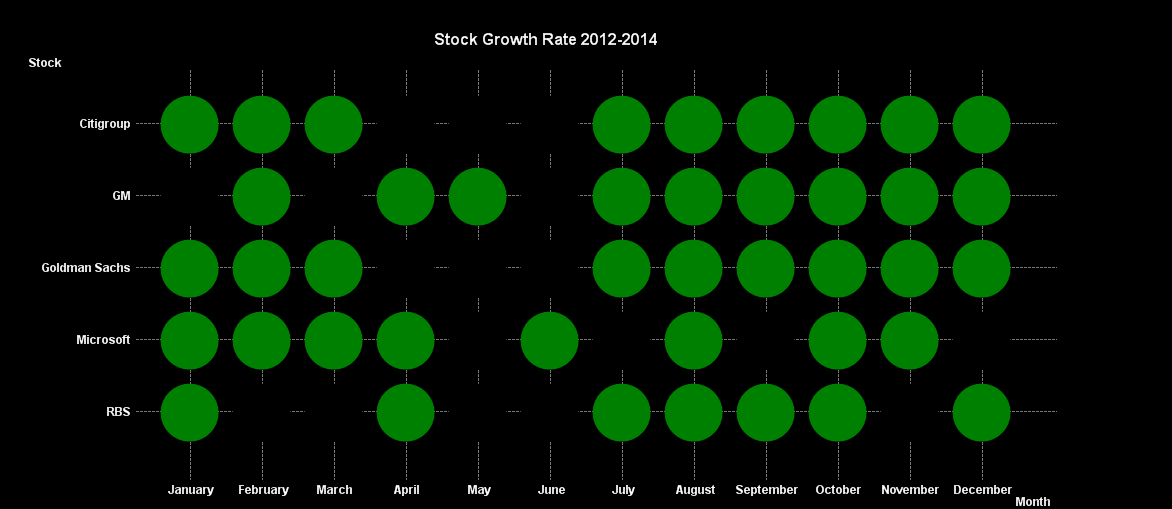
How do I make the negative percentage values appear and then turn red? Is there somewhere else I should enter the formula or is there a better way to go about it than a formula?
Thanks.
- Mark as New
- Bookmark
- Subscribe
- Mute
- Subscribe to RSS Feed
- Permalink
- Report Inappropriate Content
Hi,
please can you post a Qvw example?
Is simplest to answer to you.
Giuseppe
- Mark as New
- Bookmark
- Subscribe
- Mute
- Subscribe to RSS Feed
- Permalink
- Report Inappropriate Content
We also have a funtion Red().
Did you tried?
- Mark as New
- Bookmark
- Subscribe
- Mute
- Subscribe to RSS Feed
- Permalink
- Report Inappropriate Content
What are you trying to achieve with RGB(Avg(Growth)=255, as this will almost certainly always be 0 (Qlikview number representation for false, -1 for true), the color for red always becomes RGB(0,0,0) which is black.
Try
If(Avg(Growth)<0,RGB(255,0,0),RGB(0,128,0))
- Mark as New
- Bookmark
- Subscribe
- Mute
- Subscribe to RSS Feed
- Permalink
- Report Inappropriate Content
Hi,
the Background colour expression should more like:
If(Avg(Growth)<0, Red(),Green())
See Simple example attached
Andy
- Mark as New
- Bookmark
- Subscribe
- Mute
- Subscribe to RSS Feed
- Permalink
- Report Inappropriate Content
Thank you Piet this works!
- Mark as New
- Bookmark
- Subscribe
- Mute
- Subscribe to RSS Feed
- Permalink
- Report Inappropriate Content
You're welcome Danielle
If this has answered your question, can you please mark the relevant answers as Correct? It will close this thread and help others find correct answers and let contributing members know this requires no more attention.