Unlock a world of possibilities! Login now and discover the exclusive benefits awaiting you.
- Qlik Community
- :
- All Forums
- :
- QlikView App Dev
- :
- Increase space between dimension and text on axis ...
- Subscribe to RSS Feed
- Mark Topic as New
- Mark Topic as Read
- Float this Topic for Current User
- Bookmark
- Subscribe
- Mute
- Printer Friendly Page
- Mark as New
- Bookmark
- Subscribe
- Mute
- Subscribe to RSS Feed
- Permalink
- Report Inappropriate Content
Increase space between dimension and text on axis values
Hi everyone,
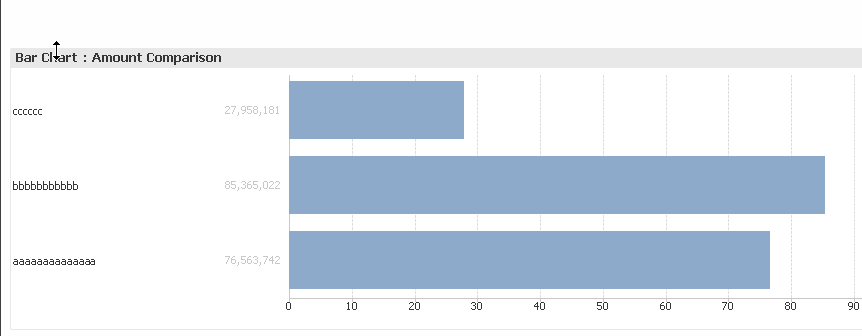
I'd like to add some space between my dimension lables and the numeric values along the Y axis, as highlighted in the attached chart, so they don't appear bunched up.
Thanks!
Scott
- « Previous Replies
- Next Replies »
Accepted Solutions
- Mark as New
- Bookmark
- Subscribe
- Mute
- Subscribe to RSS Feed
- Permalink
- Report Inappropriate Content
Like this attached?
- Mark as New
- Bookmark
- Subscribe
- Mute
- Subscribe to RSS Feed
- Permalink
- Report Inappropriate Content
You can just add some spaces in front of your expression to add the necessary padding:
- Mark as New
- Bookmark
- Subscribe
- Mute
- Subscribe to RSS Feed
- Permalink
- Report Inappropriate Content
If I understand,
you can use ctrl+shift and then move the red rectangle
and in the "Axis" tab uncheck "Truncate Label" (but alignment is left)
Here an example of the output

- Mark as New
- Bookmark
- Subscribe
- Mute
- Subscribe to RSS Feed
- Permalink
- Report Inappropriate Content
Thanks Petter.
That didn't work. Something is required between ' '. If I just put blank spaces, it is not reflected in the the graph.
I was able to solve my problem by reducing the font size and that works for now, but I woudl still like to know how to do this while also maintaining the right justification of the dimension lables.
- Mark as New
- Bookmark
- Subscribe
- Mute
- Subscribe to RSS Feed
- Permalink
- Report Inappropriate Content
Hi Scott,
The solution given by Petter works absolutely fine. You need to write your expression as below with preceding spaces. No need to reduce your font size as well.
= ' ' & Sum(VALUE)
Regards
Sumeet
- Mark as New
- Bookmark
- Subscribe
- Mute
- Subscribe to RSS Feed
- Permalink
- Report Inappropriate Content
Hi,
Create a variable like vSpace then assign value =repeat(' ',8).
Goto your expression ->vspace & sum(Amount).
Hope it helps
- Mark as New
- Bookmark
- Subscribe
- Mute
- Subscribe to RSS Feed
- Permalink
- Report Inappropriate Content
Hi Sumeet,
It tired the expression again as you suggested and it's still not working. Check out the image below that shows my expression and results.
- Mark as New
- Bookmark
- Subscribe
- Mute
- Subscribe to RSS Feed
- Permalink
- Report Inappropriate Content
Hey krishna20,
I created with the variable as you suggested and it's not working. Am I missing something?
- Mark as New
- Bookmark
- Subscribe
- Mute
- Subscribe to RSS Feed
- Permalink
- Report Inappropriate Content
What if you change the dimension values instead, a calculated dimension like
=[Device Activity Status] & ' '
- Mark as New
- Bookmark
- Subscribe
- Mute
- Subscribe to RSS Feed
- Permalink
- Report Inappropriate Content
Hey swuehl ,
I tried that and it didn't work either.
I'm struggling with this because it seems like this type of answer, where additional spacing is added, is working for folks, but it's not having any impact on my chart.
- « Previous Replies
- Next Replies »