Unlock a world of possibilities! Login now and discover the exclusive benefits awaiting you.
- Qlik Community
- :
- All Forums
- :
- QlikView App Dev
- :
- Intersection using set analysis
- Subscribe to RSS Feed
- Mark Topic as New
- Mark Topic as Read
- Float this Topic for Current User
- Bookmark
- Subscribe
- Mute
- Printer Friendly Page
- Mark as New
- Bookmark
- Subscribe
- Mute
- Subscribe to RSS Feed
- Permalink
- Report Inappropriate Content
Intersection using set analysis
Hi All,
i have a simple database attached wich is showing three informations : part number, date and quantity
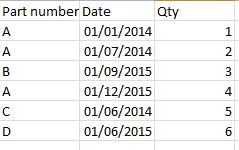
i would like to show on a table quantity of part numbers consummed in 2015 as well as the ones consummed in 2014.
What i got from my app is below table :
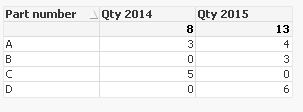
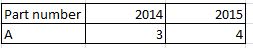
Although what i am looking for should looks like : only part number A should be taken into account as consummed both in 2014 and 2015
Attached are database and .qvw
Any help ?
Thanks in advance
Accepted Solutions
- Mark as New
- Bookmark
- Subscribe
- Mute
- Subscribe to RSS Feed
- Permalink
- Report Inappropriate Content
Use below expression for 2014
SUM({<Année = {2014},[Part number] = P({<Année= {2015}>}[Part number])>}Qty)
- Mark as New
- Bookmark
- Subscribe
- Mute
- Subscribe to RSS Feed
- Permalink
- Report Inappropriate Content
Hi Gulilaume,
The trick is that i do want to show only part numbers consummed in 2015 AND 2014.
So should the resulting chart only show A, as that the only one in both 2015 and 2014?
- Mark as New
- Bookmark
- Subscribe
- Mute
- Subscribe to RSS Feed
- Permalink
- Report Inappropriate Content
Use below expression for 2014
SUM({<Année = {2014},[Part number] = P({<Année= {2015}>}[Part number])>}Qty)
- Mark as New
- Bookmark
- Subscribe
- Mute
- Subscribe to RSS Feed
- Permalink
- Report Inappropriate Content
LOAD [Part number],
     Date,
     Year(Date) As Yr,
     Qty
FROM
[TEST exclusion.xlsx]
(ooxml, embedded labels, table is Feuil1);
Dim: [Part number]
Expr: If(Sum({<Yr={2015}>}Qty)=0,0,Sum({<Yr={2014}>}Qty))
Sum({<Yr={2015}>}Qty)
- Mark as New
- Bookmark
- Subscribe
- Mute
- Subscribe to RSS Feed
- Permalink
- Report Inappropriate Content
To find the part numbers that have been consumed both years, you can use
= Sum ({$<[Part number]=P({$<Année={2014}>} [Part number])*P({$<Année={2015}>} [Part number])>}Qty)
and to have the same condition, but split per year, you can use
= Sum ({$<Année={2015},[Part number]=P({$<Année={2014}>} [Part number])*P({$<Année={2015}>} [Part number])>}Qty)
But I don't understand your last table. That C should be excluded, is clear. But so should B and D as I see it.
HIC
- Mark as New
- Bookmark
- Subscribe
- Mute
- Subscribe to RSS Feed
- Permalink
- Report Inappropriate Content
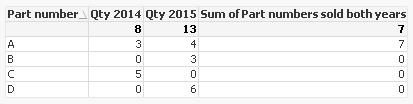
See attached.
I replaced your dimension with a calculated dimension excluding Part numbers with 0 sales in 2015 (if this is what you need - not quite clear from your description).
- Mark as New
- Bookmark
- Subscribe
- Mute
- Subscribe to RSS Feed
- Permalink
- Report Inappropriate Content
thanks guys, i will check your feedback by monday and come back to you
- Mark as New
- Bookmark
- Subscribe
- Mute
- Subscribe to RSS Feed
- Permalink
- Report Inappropriate Content
You are right Andrew. My mistake : the resulting chart should only show A
- Mark as New
- Bookmark
- Subscribe
- Mute
- Subscribe to RSS Feed
- Permalink
- Report Inappropriate Content
Correct Henric, i wrongly describe the issue : B,C and D should be excluded, not only A
- Mark as New
- Bookmark
- Subscribe
- Mute
- Subscribe to RSS Feed
- Permalink
- Report Inappropriate Content
Thanks guys , your feebacks helped me to understand i am facing other issuesto build the app requested. I need to describe those more precisely in a new trend as Manish Kachhia answerd the initial question even though the question was not quite clear)
Guillaume