Unlock a world of possibilities! Login now and discover the exclusive benefits awaiting you.
- Qlik Community
- :
- All Forums
- :
- QlikView App Dev
- :
- Intervalmatch help needed
- Subscribe to RSS Feed
- Mark Topic as New
- Mark Topic as Read
- Float this Topic for Current User
- Bookmark
- Subscribe
- Mute
- Printer Friendly Page
- Mark as New
- Bookmark
- Subscribe
- Mute
- Subscribe to RSS Feed
- Permalink
- Report Inappropriate Content
Intervalmatch help needed
Hi,
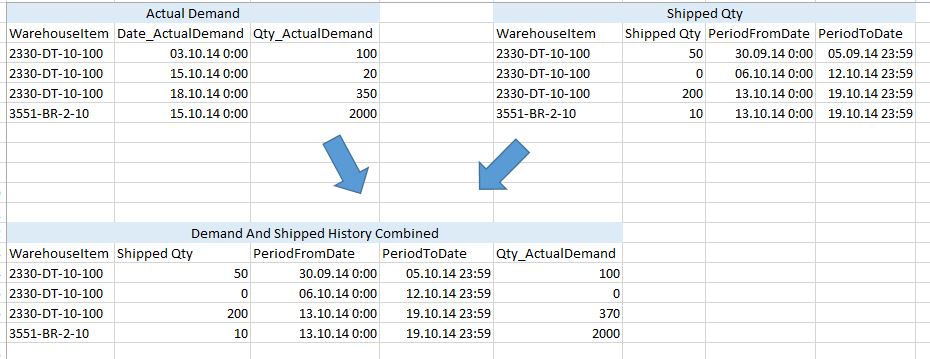
I need to combine two tables into one to analyze actual demand vs shipped qty but I have not found a good way to do this yet.
Hope somebody could help me with this.
The challenge is that table for actual demand is aggregated by date (timestamp) while shipped qty is aggregated by period with a from - to timestamp.
This shows the intended result:

I have attached the qvd file for this simplified example.
- Mark as New
- Bookmark
- Subscribe
- Mute
- Subscribe to RSS Feed
- Permalink
- Report Inappropriate Content
See attached qvw.
talk is cheap, supply exceeds demand
- Mark as New
- Bookmark
- Subscribe
- Mute
- Subscribe to RSS Feed
- Permalink
- Report Inappropriate Content
Thanks Gysbert,
The actual data contains many million rows. Do you recommend this solution in this case, or is there a different method to sum(ActualDemandQty) in the script?
- Mark as New
- Bookmark
- Subscribe
- Mute
- Subscribe to RSS Feed
- Permalink
- Report Inappropriate Content
Surely you don't intend to show all the millions of rows in a sheet object at the lowest level of detail?
talk is cheap, supply exceeds demand
- Mark as New
- Bookmark
- Subscribe
- Mute
- Subscribe to RSS Feed
- Permalink
- Report Inappropriate Content
The table showing the ship qty also contains other information such as forecast for the period.
So what I really want to do is to analyze Forecast vs Actual Demand vs Shipped Qty over different time intervals.
Actual demand I need to get from a different table and this is showing demand per date, not per period.
So I have about 30.000 items and 150 periods per item.
I need to show this data for every item and then I will have to aggregate periods to show e.g. YTD, LY, Quarters etc. and calculate forecast accuracy over the time interval and highlight items with low accuracy.
Ideally (I think..) I would want the sum(actual demand qty) joined into the shipqty table.
Not sure if the explanation helps?
- Mark as New
- Bookmark
- Subscribe
- Mute
- Subscribe to RSS Feed
- Permalink
- Report Inappropriate Content
If you want you can join all the data in the script into one table. Or you can create additional summary tables. But I'd start with giving the users options to make selections so they're not confronted with non-performing sheet objects that try to show 30.000 items over 150 periods at the same time.
talk is cheap, supply exceeds demand
- Mark as New
- Bookmark
- Subscribe
- Mute
- Subscribe to RSS Feed
- Permalink
- Report Inappropriate Content
I agree.
How would you do it if we were to join all data into one table in the example attached?
Regards,
Freddy
- Mark as New
- Bookmark
- Subscribe
- Mute
- Subscribe to RSS Feed
- Permalink
- Report Inappropriate Content
Not that I recommend it but, this should do it:
ActualDemand:
LOAD WarehouseItem,
    Date_ActualDemand,
    Qty_ActualDemand
FROM [ActualDemand.qvd] (qvd);

Tmp:
LOAD WarehouseItem,
    [Shipped Qty],
    PeriodFromDate,
    PeriodToDate
FROM [ActualDeliveries.qvd] (qvd);

join(ActualDemand)
IntervalMatch(Date_ActualDemand,WarehouseItem)
LOAD PeriodFromDate,PeriodToDate,WarehouseItem
Resident Tmp;

join(ActualDemand)
LOAD * Resident Tmp;

Drop Table Tmp;
talk is cheap, supply exceeds demand