Unlock a world of possibilities! Login now and discover the exclusive benefits awaiting you.
- Qlik Community
- :
- All Forums
- :
- QlikView App Dev
- :
- Is there any way to programmatically set Max Bubbl...
- Subscribe to RSS Feed
- Mark Topic as New
- Mark Topic as Read
- Float this Topic for Current User
- Bookmark
- Subscribe
- Mute
- Printer Friendly Page
- Mark as New
- Bookmark
- Subscribe
- Mute
- Subscribe to RSS Feed
- Permalink
- Report Inappropriate Content
Is there any way to programmatically set Max Bubble Size in Scatter Chart?
I'm using QlikView 11.
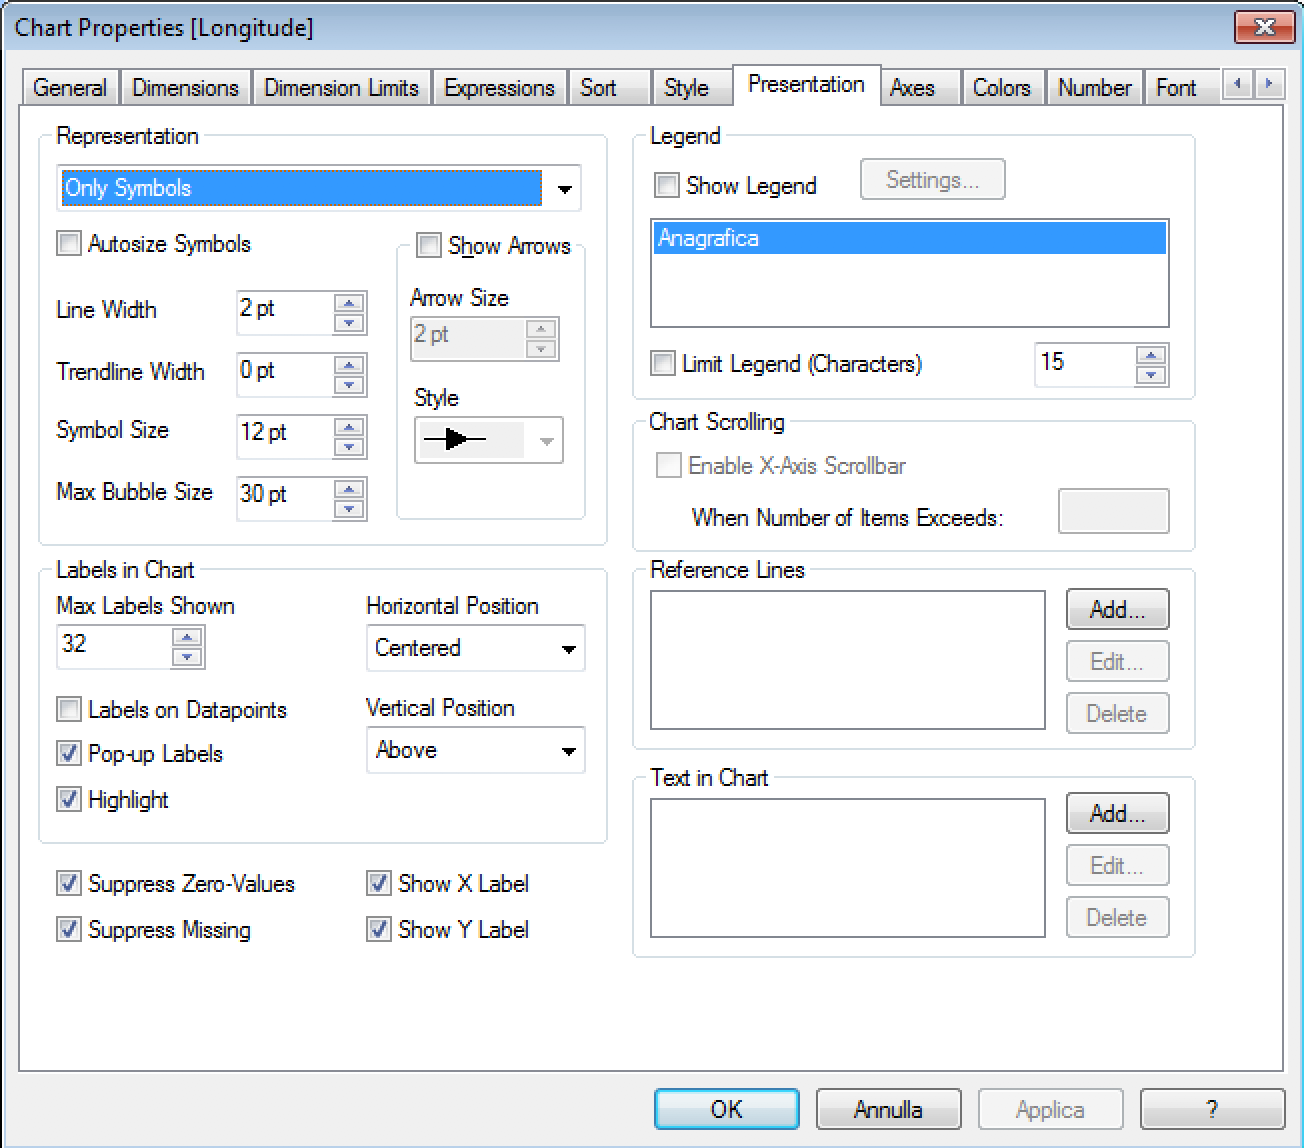
In Scatter Charts I know the way to set the Max Bubble Size (Presentation Tab) or to set the bubble dimension (via the Z-axis dimension).
I can't find any way to set the Max Bubble Size programmatically. For example, when printing data on a map I want the max bubble size to increase when coming in or decrease when zooming out.
I seem to can't find a way to do so, but I don't know if I'm missing something or if it's not possible at all.
Thanks in advance for any help. 
- Mark as New
- Bookmark
- Subscribe
- Mute
- Subscribe to RSS Feed
- Permalink
- Report Inappropriate Content
I'm not sure if this will help:
sub SymbolSize
set v = ActiveDocument.Variables("vSymbolSize")
intSymbolSize = v.GetContent.String
set chart = ActiveDocument.GetSheetObject("CH66")
set p = chart.GetProperties
p.ChartProperties.SymbolSize = intSymbolSize
chart.SetProperties p
end sub
- Mark as New
- Bookmark
- Subscribe
- Mute
- Subscribe to RSS Feed
- Permalink
- Report Inappropriate Content
Hi m w and thanks for your reply.
I'm not very practical with subroutines, do you mind to be more specific about where should I write this code and how can I activate it? It would be very helpful for me.
I understand the logic of what you wrote and if you can point out some resource I'm sure to find a way to solve my problem. It would be fun to learn a new technique as well.
Thank you again.
- Mark as New
- Bookmark
- Subscribe
- Mute
- Subscribe to RSS Feed
- Permalink
- Report Inappropriate Content
This is a vbscript macro.
You open the macro editor (Ctrl+M) and paste the script.
Then add an input box with a variable named vSymbolSize (to match the name in the code).
Finally you set an OnInput trigger on the variable with an action that runs the macro (SymbolSize)