Unlock a world of possibilities! Login now and discover the exclusive benefits awaiting you.
- Qlik Community
- :
- All Forums
- :
- QlikView App Dev
- :
- Is there any way to recreate this graph in qlikvie...
- Subscribe to RSS Feed
- Mark Topic as New
- Mark Topic as Read
- Float this Topic for Current User
- Bookmark
- Subscribe
- Mute
- Printer Friendly Page
- Mark as New
- Bookmark
- Subscribe
- Mute
- Subscribe to RSS Feed
- Permalink
- Report Inappropriate Content
Is there any way to recreate this graph in qlikview?
Hi all
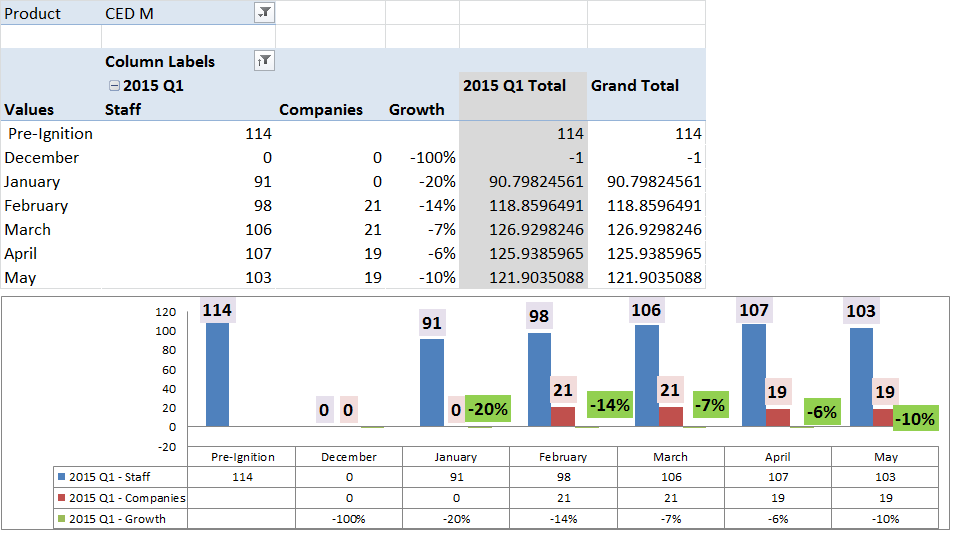
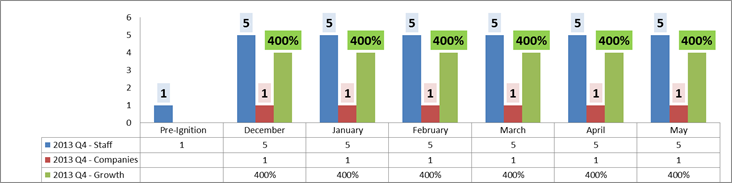
I am busy evaluating qlikview to see if we can use it. One of the graphs we regularly use is in the picture below. I can get the graph with just one month data but it stacks all the bars once I have more than one month. Also, I cannot seem to embed the table into the graph but that seems only reproducible by having the table separately.
Thanks
- Mark as New
- Bookmark
- Subscribe
- Mute
- Subscribe to RSS Feed
- Permalink
- Report Inappropriate Content
If you create a bar chart with two dimensions and one expression you can make that kind of bar chart. It's also possible with one dimension and three expressions. You can't embed the table into the chart.The table indeed has to be created separately.
talk is cheap, supply exceeds demand
- Mark as New
- Bookmark
- Subscribe
- Mute
- Subscribe to RSS Feed
- Permalink
- Report Inappropriate Content
So you cannot have both multiple dimensions and expressions as I have above?
- Mark as New
- Bookmark
- Subscribe
- Mute
- Subscribe to RSS Feed
- Permalink
- Report Inappropriate Content
That's not what I said. You can have
Two dimensions + one expression
Or
One dimension + N expressions where N is a positive integer larger than 0.
As far as I can tell your chart fits one of those two scenario's.
talk is cheap, supply exceeds demand
- Mark as New
- Bookmark
- Subscribe
- Mute
- Subscribe to RSS Feed
- Permalink
- Report Inappropriate Content
Can you please check this link if your requirement fullfill using this
Vikas
If the issue is solved please mark the answer with Accept as Solution & like it.
If you want to go quickly, go alone. If you want to go far, go together.
- Mark as New
- Bookmark
- Subscribe
- Mute
- Subscribe to RSS Feed
- Permalink
- Report Inappropriate Content
Could you post your data or app?
You can add the table and the graph into container to make them better aligned.
Feeling Qlikngry?
- Mark as New
- Bookmark
- Subscribe
- Mute
- Subscribe to RSS Feed
- Permalink
- Report Inappropriate Content
Hi
Here is an example of the table. Being new I may not be using Qlikview properly- but as I understand it- my rows here would be the dimensions, the columns the expressions.
Regards