Unlock a world of possibilities! Login now and discover the exclusive benefits awaiting you.
- Qlik Community
- :
- All Forums
- :
- QlikView App Dev
- :
- Is there anyway I can replicate this chart in Qlik...
- Subscribe to RSS Feed
- Mark Topic as New
- Mark Topic as Read
- Float this Topic for Current User
- Bookmark
- Subscribe
- Mute
- Printer Friendly Page
- Mark as New
- Bookmark
- Subscribe
- Mute
- Subscribe to RSS Feed
- Permalink
- Report Inappropriate Content
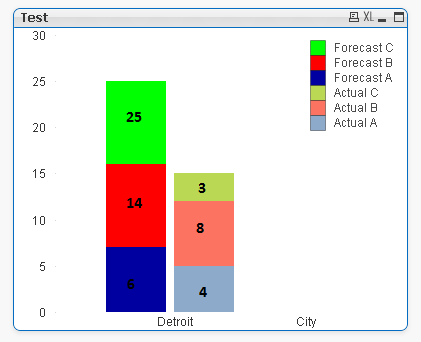
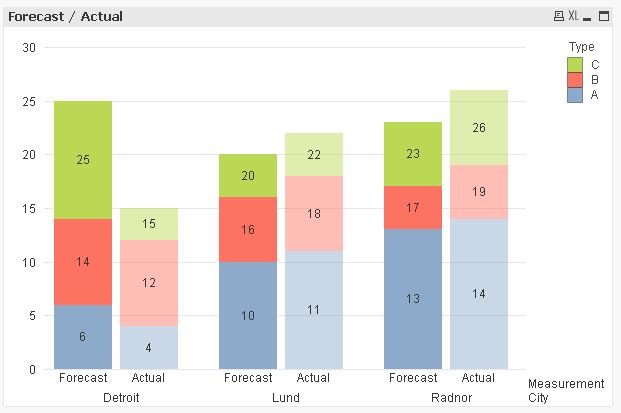
Is there anyway I can replicate this chart in QlikView?
I am struggling to create this chart in Qlik. I can create the bars by expressions like Forecast C = Forecast C- Forecast B- Forecast A. but how can I show the Actual values?
- Mark as New
- Bookmark
- Subscribe
- Mute
- Subscribe to RSS Feed
- Permalink
- Report Inappropriate Content
Can you share your sample file with some data to look into?
- Mark as New
- Bookmark
- Subscribe
- Mute
- Subscribe to RSS Feed
- Permalink
- Report Inappropriate Content
Actually, I need to create a graph like this so I don't have any qvw file but I can share the script for the bars.
LOAD * INLINE [
City, ForecastA, ForecastB, ForecastC, Measurement
Detroit, 6, 14, 25, Forecast
];
LOAD * INLINE [
City, ActualA, ActualB, ActualC, Measurement
Detroit, 4, 12, 15, Actual
];
Forecast bar is what I want to do and Actual bar shows what I can accomplish.
- Mark as New
- Bookmark
- Subscribe
- Mute
- Subscribe to RSS Feed
- Permalink
- Report Inappropriate Content
Try this?
City:
LOAD * INLINE [
City, ForecastA, ForecastB, ForecastC, Measurement
Detroit, 6, 14, 25, Forecast
];
Concatenate
LOAD * INLINE [
City, ActualA, ActualB, ActualC, Measurement
Detroit, 4, 12, 15, Actual
];
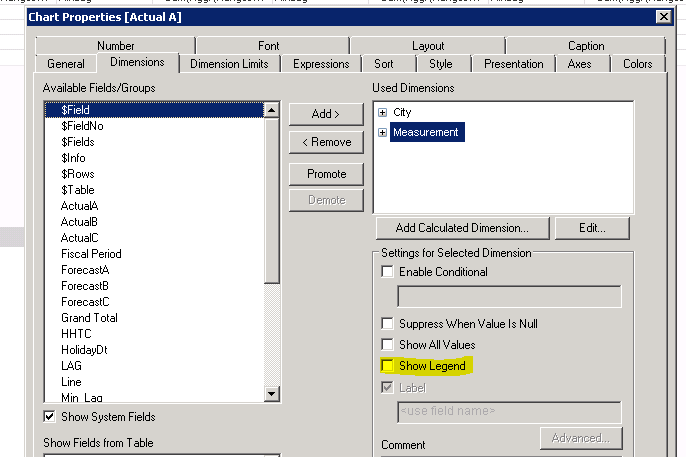
Then using bar chart add
Dim: like below image
For measurement dimension uncheck Show Legend.
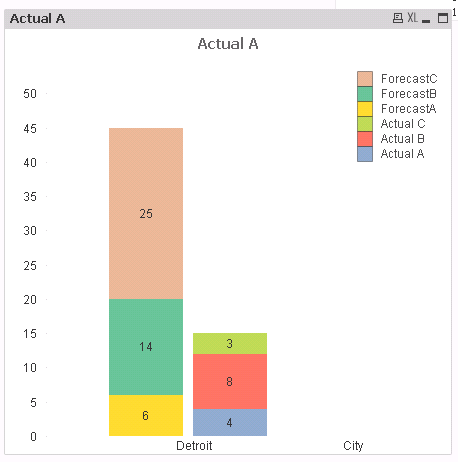
Then your expr:
= Sum(ActualA)
= Sum(ActualB)-Sum(ActualA)
=Sum(ActualC) -Sum(ActualB)
= Sum(ForecastA)
=Sum(ForecastB)
=Sum(ForecastC)
Below is what you get
- Mark as New
- Bookmark
- Subscribe
- Mute
- Subscribe to RSS Feed
- Permalink
- Report Inappropriate Content
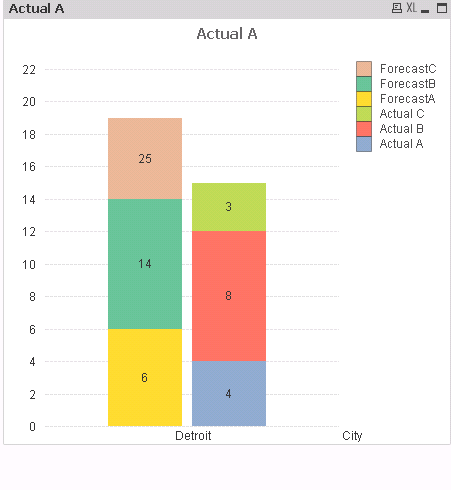
Yes. I can replicate that but what I want is to 25 bar as 25-14-6 = 5 height, 14 bar as 8 respectively. but the number inside the bar should show 25,14,6. Let me know if you do not understand my question. Thank you.
- Mark as New
- Bookmark
- Subscribe
- Mute
- Subscribe to RSS Feed
- Permalink
- Report Inappropriate Content
try below for Forecast expressions:
= Sum(ForecastA)
= Dual(Sum(ForecastB), Sum(ForecastB) - Sum(ForecastA))
=Dual(Sum(ForecastC), Sum(ForecastC) - Sum(ForecastB) - Sum(ForecastA))
- Mark as New
- Bookmark
- Subscribe
- Mute
- Subscribe to RSS Feed
- Permalink
- Report Inappropriate Content
Hi,
maybe one solution could be:
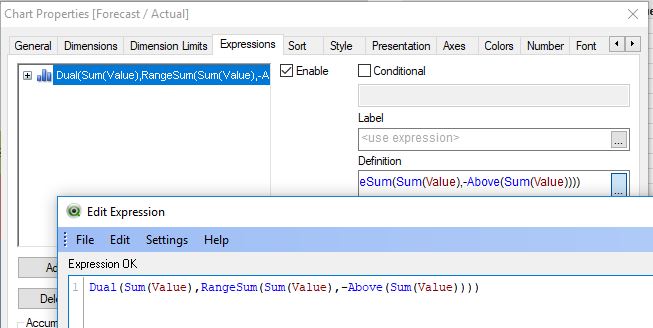
Dual(Sum(Value),RangeSum(Sum(Value),-Above(Sum(Value))))
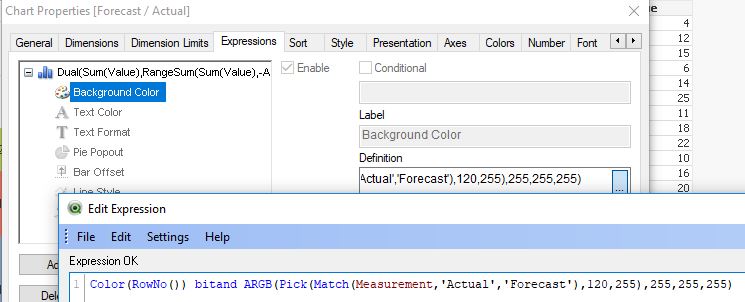
Color(RowNo()) bitand ARGB(Pick(Match(Measurement,'Actual','Forecast'),120,255),255,255,255)
tabValues:
CrossTable (Type, Value, 2)
LOAD * INLINE [
    City, Measurement, A, B, C
    Detroit, Forecast, 6, 14, 25
    Lund, Forecast, 10, 16, 20
    Radnor, Forecast, 13, 17, 23
];

CrossTable (Type, Value, 2)
LOAD * INLINE [
    City, Measurement, A, B, C
    Detroit, Actual, 4, 12, 15
    Lund, Actual, 11, 18, 22
    Radnor, Actual, 14, 19, 26
];
hope this helps
regards
Marco