Unlock a world of possibilities! Login now and discover the exclusive benefits awaiting you.
- Qlik Community
- :
- All Forums
- :
- QlikView App Dev
- :
- Re: Is this a Grid Chart or a Scatter Chart???
- Subscribe to RSS Feed
- Mark Topic as New
- Mark Topic as Read
- Float this Topic for Current User
- Bookmark
- Subscribe
- Mute
- Printer Friendly Page
- Mark as New
- Bookmark
- Subscribe
- Mute
- Subscribe to RSS Feed
- Permalink
- Report Inappropriate Content
Is this a Grid Chart or a Scatter Chart???
Hi
Can any one sens me a qvw example of this Grid Chart/Scatter Chart?
Thank you
Mc
Accepted Solutions
- Mark as New
- Bookmark
- Subscribe
- Mute
- Subscribe to RSS Feed
- Permalink
- Report Inappropriate Content
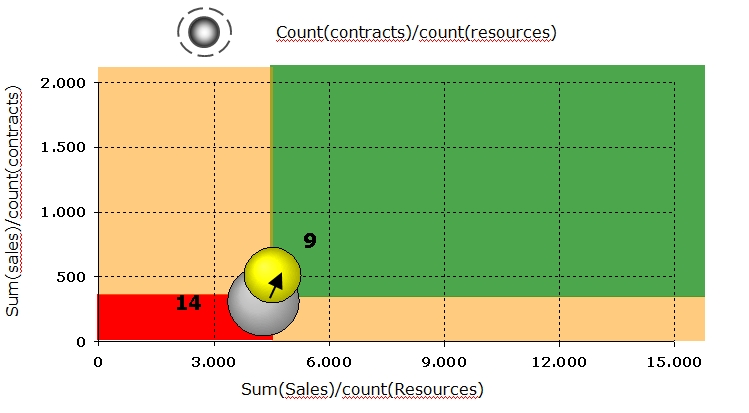
As the axises are continuous It's likely a scatter chart.
With Year as a dimension.
- Mark as New
- Bookmark
- Subscribe
- Mute
- Subscribe to RSS Feed
- Permalink
- Report Inappropriate Content
p.s.
Yellow sphere -> 2012
Grey Sphere -> 2011
Sorry.
Thank You
- Mark as New
- Bookmark
- Subscribe
- Mute
- Subscribe to RSS Feed
- Permalink
- Report Inappropriate Content
As the axises are continuous It's likely a scatter chart.
With Year as a dimension.
- Mark as New
- Bookmark
- Subscribe
- Mute
- Subscribe to RSS Feed
- Permalink
- Report Inappropriate Content
Ok, but I would like to have the ability to custom color the background quadrants with multiple colors.
It is possible?
Thanks to all
MC
- Mark as New
- Bookmark
- Subscribe
- Mute
- Subscribe to RSS Feed
- Permalink
- Report Inappropriate Content
No, I think you can't do it dynamicaly.
Only as a background image.
As a workaround you can use reference lines to mark the boundaries (Presentation Tab).
If you know how to write a webservice that returns such background image dynamically, you can use dynamic background image (the same way as QV handles google maps).
Or you can create an extension object but it will work only in web view (ajax).