Unlock a world of possibilities! Login now and discover the exclusive benefits awaiting you.
- Qlik Community
- :
- All Forums
- :
- QlikView App Dev
- :
- Re: Keeping selection list even if no values
- Subscribe to RSS Feed
- Mark Topic as New
- Mark Topic as Read
- Float this Topic for Current User
- Bookmark
- Subscribe
- Mute
- Printer Friendly Page
- Mark as New
- Bookmark
- Subscribe
- Mute
- Subscribe to RSS Feed
- Permalink
- Report Inappropriate Content
Keeping selection list even if no values
Best regards
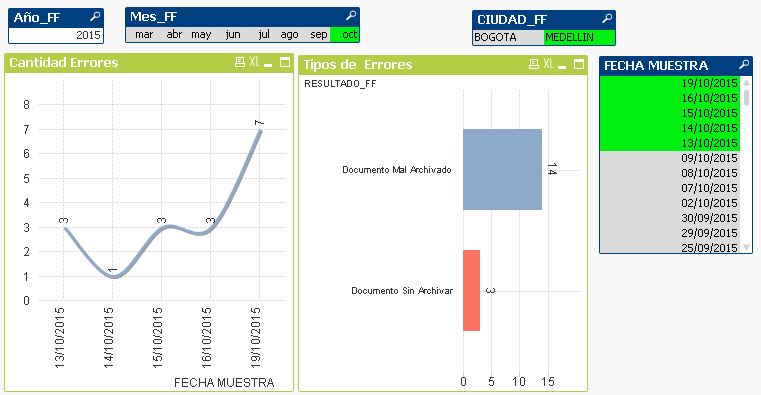
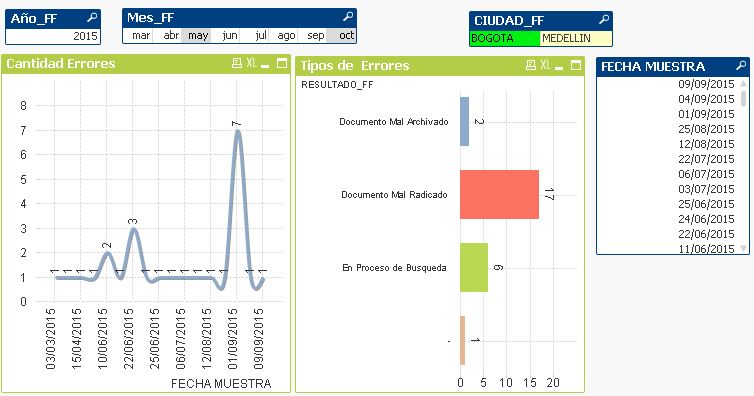
I have a situation in which I as a graphic filter a list box type date. Also I have another list box to Town. When you select a date range for a given city, it makes me o one graphic without problem. When I select another city maintaining the same date range graphics draw another curve deselected date range. This is logical because no data for that city at that date range. In any way I require that the graph is maintained for the same date range placing 0 in each of the selected days.
If the city has data
If the city has no data: Graph with another date range where he found data (required to maintain the same level of previous dates)
Thanks in advance and sorry if the question is elementary.
- Tags:
- new_to_qlikview
- Mark as New
- Bookmark
- Subscribe
- Mute
- Subscribe to RSS Feed
- Permalink
- Report Inappropriate Content
Hi,
You can try to Lock the List Box after selected the Date Range
OR
You can use the date range in your expression using the Set analysis
Like
=Sum({<DateField={">=$(=vStartDate)<=$(=vEndDate)"}>}Sales)
you can set the Start Date and EndDate value using the Variable
- Mark as New
- Bookmark
- Subscribe
- Mute
- Subscribe to RSS Feed
- Permalink
- Report Inappropriate Content
Hi,
Try unchecking Supress zero values and Supress Missing options in
Chart Properties -> Presentation Tab
Even it is not working, then you have insert 0 values records for that city and that date then only you can display 0 for those missing dates.
Hope this helps you.
Regards,
Jagan.
- Mark as New
- Bookmark
- Subscribe
- Mute
- Subscribe to RSS Feed
- Permalink
- Report Inappropriate Content
Thanks for your help.
Could you please tell me how to set the variables?. I´m just a end user and I do not know so much about programming.
- Mark as New
- Bookmark
- Subscribe
- Mute
- Subscribe to RSS Feed
- Permalink
- Report Inappropriate Content
Jagan, thank you very much for your answer. I tried it and it continues the same.
Regards
- Mark as New
- Bookmark
- Subscribe
- Mute
- Subscribe to RSS Feed
- Permalink
- Report Inappropriate Content
As you said, it's QV standard associative DB behaviour what you've observed.
If you absolutely want to keep the dates, I think you need to uncouple the dates selection from your city selection.
Maybe you can do this using variables as suggested, another option might be alternate states.
In attached sample, I created an alternate state in document properties, set the list box for date selection to that state (and added some stuff to give the users hints if the dates are available in current city selections or not, but without changing the date selection state, so it's not necessary for the demo).
City list box is in default state.
The chart is also set to alternate state, Date is used as dimension.
Then one expression:
=Sum({$<Date= p({AS}) >} Value) +sum(0)
A little bit complex, but your request is outside QV default behaviour, hence the extra-work.
Hope this helps.
- Mark as New
- Bookmark
- Subscribe
- Mute
- Subscribe to RSS Feed
- Permalink
- Report Inappropriate Content
It should work, can you share the sample data.
Regards,
Jagan.
- Mark as New
- Bookmark
- Subscribe
- Mute
- Subscribe to RSS Feed
- Permalink
- Report Inappropriate Content
swuehl, thanks for your answer.
I do not really know how to set a variable and did not received any attached example. Anyway I have a personal licence so I could not open any .qwv file from anotther person.
I just applied the expression you suggested to me and it works that I need it even without setting any parameters in document properties and list box !
I really appreciate your help.
- Mark as New
- Bookmark
- Subscribe
- Mute
- Subscribe to RSS Feed
- Permalink
- Report Inappropriate Content
Hello jagan.
Thank you very much for your interest and help.
I could get the solution from swuehl suggestion.
Regards