Unlock a world of possibilities! Login now and discover the exclusive benefits awaiting you.
- Qlik Community
- :
- All Forums
- :
- QlikView App Dev
- :
- Re: Keeping the pivot table columns/structure the ...
- Subscribe to RSS Feed
- Mark Topic as New
- Mark Topic as Read
- Float this Topic for Current User
- Bookmark
- Subscribe
- Mute
- Printer Friendly Page
- Mark as New
- Bookmark
- Subscribe
- Mute
- Subscribe to RSS Feed
- Permalink
- Report Inappropriate Content
Keeping the pivot table columns/structure the same
Hi All,
I have a pivot table showing financial data for Business Units (1st column) and expanding into Cost Centres (2nd column). As you can see to the right, I have many expressions which I've organized according to actuals, or part of the first forecast, or part of the outer years, as shown by the colours. These coloured headers are just text boxes which I've created, because it seemed the most practical way to do this. (I've looked up doing double headers in qlik but it seems very complicated and only if you can do the setup when you're loading the script as you're basically calculating the values and creating new dimensions for those expressions, however my dashboard allows them to change the reporting date so that all the shown values change, which won't work if I set values in the load script for each expression to be a dimension)
You can see my pivot here:
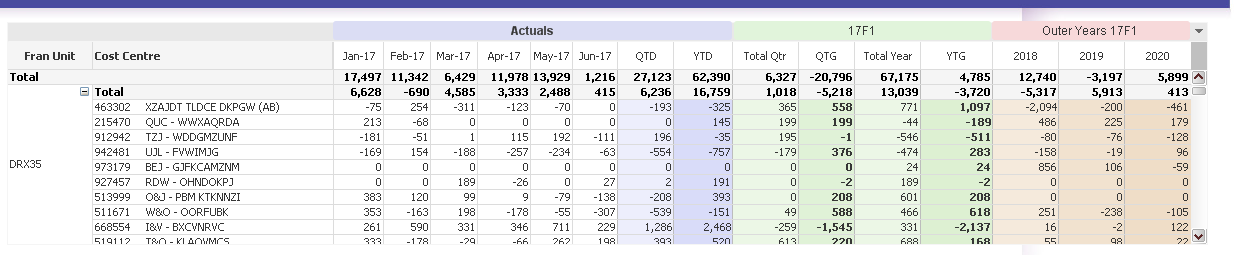
Anyway, my issue is that higher level managers will need to collapse all the business units to see the totals as a whole, and when it does that, the Cost Centre column disappears and the whole pivot table shifts over like this:
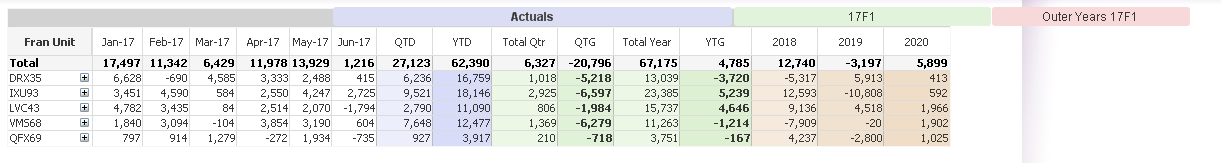
As you can see, now the labels are all incorrect.
Is there a way to make the structure of the pivot permanent, so that even if they collapse franchise units, it will remain the same? Always fully expanded does not solve this as they need to still be able to collapse the Cost Centre dimension.
Thoughts?
Accepted Solutions
- Mark as New
- Bookmark
- Subscribe
- Mute
- Subscribe to RSS Feed
- Permalink
- Report Inappropriate Content
- Mark as New
- Bookmark
- Subscribe
- Mute
- Subscribe to RSS Feed
- Permalink
- Report Inappropriate Content
Hi,
can you attach a sample of the model?
Ariel
- Mark as New
- Bookmark
- Subscribe
- Mute
- Subscribe to RSS Feed
- Permalink
- Report Inappropriate Content
Hi Richard,
this is the best I can do.
See Attachment.
Regards,
Antonio
- Mark as New
- Bookmark
- Subscribe
- Mute
- Subscribe to RSS Feed
- Permalink
- Report Inappropriate Content
Don't know why I didn't think of this. I use variables like this for so many other work-arounds. Thanks, I think this is likely to be the least complicated solve.
Cheers