Unlock a world of possibilities! Login now and discover the exclusive benefits awaiting you.
- Qlik Community
- :
- All Forums
- :
- QlikView
- :
- Keywords : TOTAL, ALL & DISTINCT
- Subscribe to RSS Feed
- Mark Topic as New
- Mark Topic as Read
- Float this Topic for Current User
- Bookmark
- Subscribe
- Mute
- Printer Friendly Page
- Mark as New
- Bookmark
- Subscribe
- Mute
- Subscribe to RSS Feed
- Permalink
- Report Inappropriate Content
Keywords : TOTAL, ALL & DISTINCT
Hello everybody !
I'm currently working on QV (amazing software, i have to admit it) but i still have several interrogations...
One of them is the definition between TOTAL, ALL & DISTINCT.
I know DISTINCT avoids the duplication of the values (i assume the List Boxes uses something similar to avoid displaying twice some values).
But, however, what's the difference between TOTAL & ALL ?
Thanks a lot for your future explanations 😉
Best regards
- Mark as New
- Bookmark
- Subscribe
- Mute
- Subscribe to RSS Feed
- Permalink
- Report Inappropriate Content
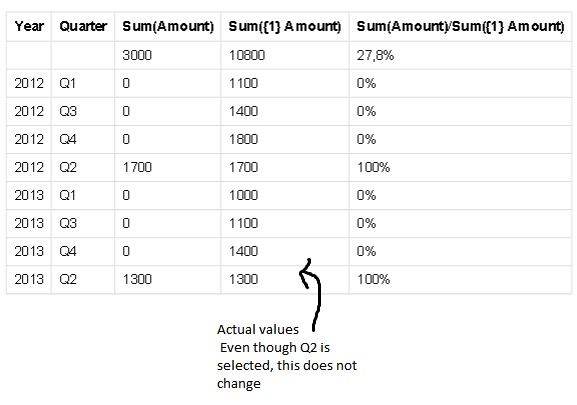
As best I understand it, ALL means every value in your data set, whether or not it is excluded by your current selections. So if you have five years of data, and have selected a year, and have a chart showing sum(ALL amount) by month, each month will have the same total, which will be the sum of all amounts for the past five years. Note that it is now preferred to use sum({1} amount), which has the same effect.
Total, on the other hand, does take your current selections into account. But it ignores what row you're on in a table. So back to our example, sum(TOTAL amount) would again have the same total for each month, but it would be the sum of all amounts for the selected year.
Here's how QlikView describes it:
"If the word total occurs before an expression, the calculation will be made over all possible values given the current selections, but disregarding the chart dimensions.
The total qualifier may be followed by a list of one or more field names within angle brackets. These field names should be a subset of the chart dimensions. In this case the calculation will be made disregarding all chart dimensions except those listed, i.e. one value will be returned for each combination of field values in the listed dimension fields. Also fields which are not currently a dimension in a chart may be included in the list. This may be useful in the case of group dimensions, where the dimension fields are not fixed. Listing all of the dimensions in the group causes the function to work when the cycle or drill-down level changes.
In previous QlikView versions, the all qualifier may occur before an expression. This is equivalent to using {1} total. In such a case the calculation will be made over all the values of the field in the document, disregarding the chart dimensions and current selections. (The same value is always returned regardless of the logical state in the document.) If the all qualifier is used, a set expression cannot be used, since the all qualifier defines a set by itself. For legacy reasons, the all qualifier will still work in this QlikView version, but may be removed in coming versions."
- Mark as New
- Bookmark
- Subscribe
- Mute
- Subscribe to RSS Feed
- Permalink
- Report Inappropriate Content
In addition to what John has explained here are few examples of ALL and TOTAL keywords
sum(All Sales) returns aggregated sales irrespective of any dimension and any selection
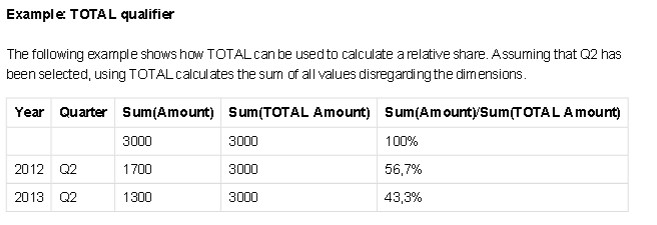
sum(Sales)/sum(total Sales) returns the share within the selection
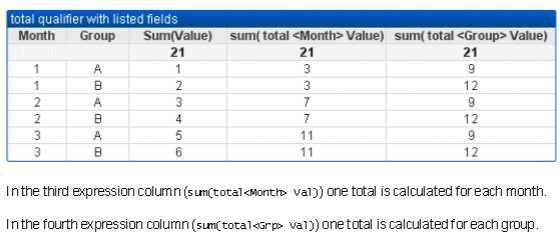
sum(Sales)/sum(total <Month> Sales) returns the share within the selection for each
Month
sum(Sales)/sum(total <Month,Grp> Sales) returns the share within the selection for
each Month and Grp
sum(Sales)/sum(total <Qtr,Month,Week> Sales) possible syntax for use with a time
drill-down group
sum({1} total Sales) returns sales within the entire document
- Mark as New
- Bookmark
- Subscribe
- Mute
- Subscribe to RSS Feed
- Permalink
- Report Inappropriate Content
Total is used to calculate a total against some field or expression written inside angle brackets
sum(Total<fieldname> value)
Totaal is depenent on field name i.e it will show you total based on Fieldname
where
sum( All Value) it is not depent on any field or expression.
it will also show you total
hope this hell
- Mark as New
- Bookmark
- Subscribe
- Mute
- Subscribe to RSS Feed
- Permalink
- Report Inappropriate Content
As we know, when aggregation function is used, certain record values are aggregated and a single result is produced. How qlikview identifies that relevant CERTAIN records?
When working with charts, it is based on 2 restrictions:
- 1. Dimensional value
- 2. Selections
These 2 defines the scope of aggregation.
Sometimes, we need to come across these restrictions and use an aggregate function.In chart, it is achieved by using
- 1. TOTAL qualifier – disregards dimensional grouping
Aggregation is performed on all possible values
If still we want grouping on particular dimension, we can use as
- 2. Set analysis - identifier{1} is used which disregards selections
Aggregation is performed on all possible values but split by dimension
- 3. ALL qualifier – Both works of TOTAL and Set analysis is done
Both are same
=sum (All Sales)
=sum ({1} Total Sales)
- Mark as New
- Bookmark
- Subscribe
- Mute
- Subscribe to RSS Feed
- Permalink
- Report Inappropriate Content
Thank you so much for this great explanation. So clear and logical. 🙂
- Mark as New
- Bookmark
- Subscribe
- Mute
- Subscribe to RSS Feed
- Permalink
- Report Inappropriate Content
This is excellent. For some reason, I was battling with the Total <> function and your explanation is golden
- Mark as New
- Bookmark
- Subscribe
- Mute
- Subscribe to RSS Feed
- Permalink
- Report Inappropriate Content
This is excellent. For some reason, I was battling with the Total <> function and your explanation is golden
- Mark as New
- Bookmark
- Subscribe
- Mute
- Subscribe to RSS Feed
- Permalink
- Report Inappropriate Content
Hi Bharath,
Thanks for the elaborate answer.
SUM(ALL Amount) on the other hand yield the result on entire data set regardless of current selections or dimensions. So it will give same value as net total, and for each row as well which will be different from SUM({1} Amount). Won't SUM({1} Amount) be equal to SUM(TOTAL <Month>Amount) which in turn should be equal to SUM(Amount) ?
Regards,
Gagan