Unlock a world of possibilities! Login now and discover the exclusive benefits awaiting you.
- Qlik Community
- :
- All Forums
- :
- QlikView App Dev
- :
- Re: Last N month values
- Subscribe to RSS Feed
- Mark Topic as New
- Mark Topic as Read
- Float this Topic for Current User
- Bookmark
- Subscribe
- Mute
- Printer Friendly Page
- Mark as New
- Bookmark
- Subscribe
- Mute
- Subscribe to RSS Feed
- Permalink
- Report Inappropriate Content
Last N month values
Hi All,
I am looking for last N months Avg values in the chart. I am using below expression
=AVG({<Date ={">=$(=Date(addmonths(Max('$(vyearmonth)'), -2), 'MMM-YYYY')) <=$(=Date(addmonths(Max('$(vyearmonth)'), -1), 'MMM-YYYY'))"} >} Sales)
which is not giving any values
My data looks like below
load * Inline
[
Date,Sales
01/05/2016,20
02/05/2016,10
03/05/2016,20
04/05/2016,20
05/05/2016,30
.........];
vyearmonth
=MONTHNAME(date#(Date,'DD/MM/YYYY'))
Kindly let me know what and where I am missing
- Mark as New
- Bookmark
- Subscribe
- Mute
- Subscribe to RSS Feed
- Permalink
- Report Inappropriate Content
Good day,
I would recommend you to add a new MonthSeq field using AutoNumber() during the creation of your master calendar which would increment by 1 for each of the months your calendar contains starting with the current month and going backwards.
You could then use this sequential numeric field in order to get the last N months as such
AVG({<MonthSeq ={">($(vNbMonths)+1)"} >} Sales)
Regards,
Philippe
- Mark as New
- Bookmark
- Subscribe
- Mute
- Subscribe to RSS Feed
- Permalink
- Report Inappropriate Content
Hi Piet,
My original file have the date format. Also I have formatted the date in the variable. But still I am not getting the values.
- Mark as New
- Bookmark
- Subscribe
- Mute
- Subscribe to RSS Feed
- Permalink
- Report Inappropriate Content
Hi Philippe,
Thank you for your response. Actually I should not touch the existing script.
- Mark as New
- Bookmark
- Subscribe
- Mute
- Subscribe to RSS Feed
- Permalink
- Report Inappropriate Content
Can you post full expression, don't use expression or please provide variable expression which you used
- Mark as New
- Bookmark
- Subscribe
- Mute
- Subscribe to RSS Feed
- Permalink
- Report Inappropriate Content
Hi Anil,
I have posted my original post.
The expression I am using :
=AVG({<Date ={">=$(=Date(addmonths(Max('$(vyearmonth)'), -2), 'MMM-YYYY')) <=$(=Date(addmonths(Max('$(vyearmonth)'), -1), 'MMM-YYYY'))"} >} Sales)
Variable I am using :
vyearmonth
=MONTHNAME(date#(Date,'DD/MM/YYYY'))
My data goes like
load * Inline
[
Date,Sales
01/05/2016,20
02/05/2016,10
03/05/2016,20
04/05/2016,20
05/05/2016,30
.........];
- Mark as New
- Bookmark
- Subscribe
- Mute
- Subscribe to RSS Feed
- Permalink
- Report Inappropriate Content
Yes but you must use the expression Sunny suggested, what do you expect to be the result of
Max(MONTHNAME(date#(Date,'DD/MM/YYYY')))
Which results from your Max('$(vyearmonth)')
??
In these cases it is always good to use e.g a straight table where you use the expression but leave the label of the expression blank. The label will then show the result of $ sign expansions so you can check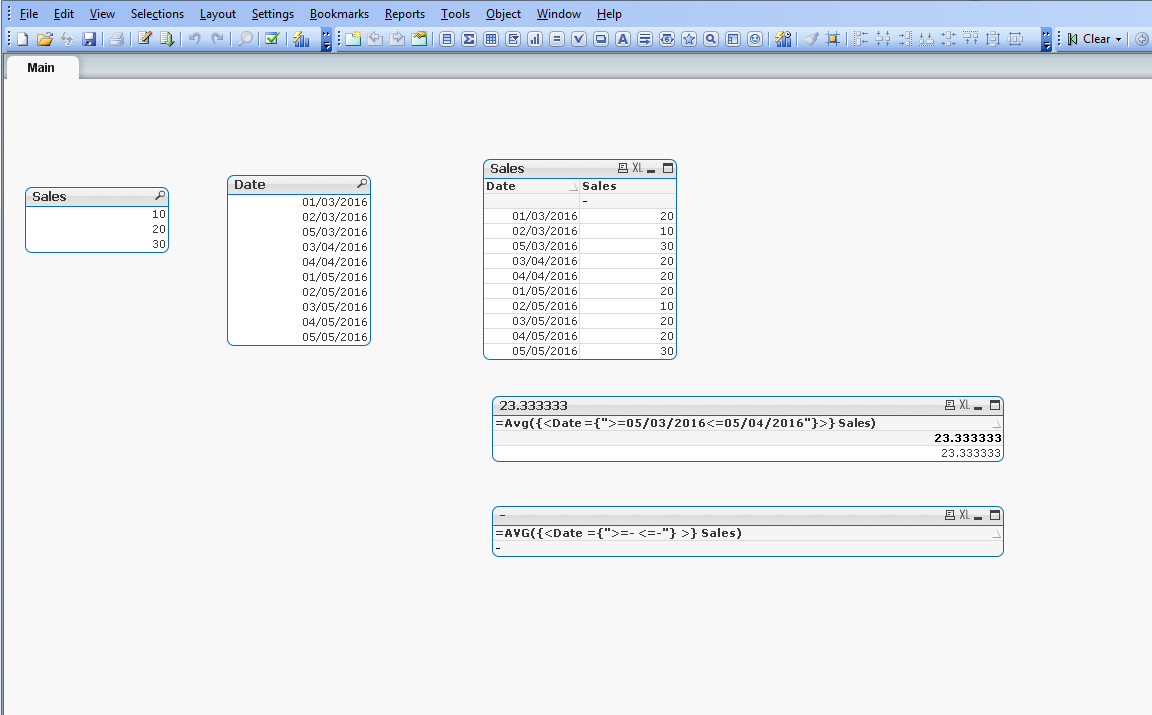
- Mark as New
- Bookmark
- Subscribe
- Mute
- Subscribe to RSS Feed
- Permalink
- Report Inappropriate Content
And the document attached
- Mark as New
- Bookmark
- Subscribe
- Mute
- Subscribe to RSS Feed
- Permalink
- Report Inappropriate Content
Hi Piet,
I was expecting last N month, for Ex ,in this case even though I am having 3 months of data I need to get last 2 months only in the pivot table.
- Mark as New
- Bookmark
- Subscribe
- Mute
- Subscribe to RSS Feed
- Permalink
- Report Inappropriate Content
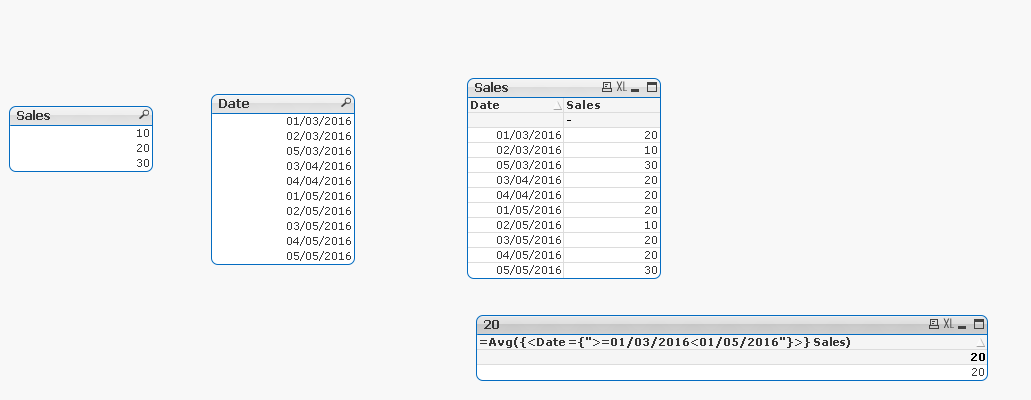
?? Yes ok, but as you can see in my test document the expression is restricting the outcome to specific dates. So what is your question? If you need complete months you can add monthstart to the expression:
=Avg({<Date ={">=$(=Date(AddMonths(MonthStart(Max(Date)), -2), 'DD/MM/YYYY'))<$(=Date(MonthStart(Max(Date)), 'DD/MM/YYYY'))"}>} Sales)
The result in my example:
- Mark as New
- Bookmark
- Subscribe
- Mute
- Subscribe to RSS Feed
- Permalink
- Report Inappropriate Content
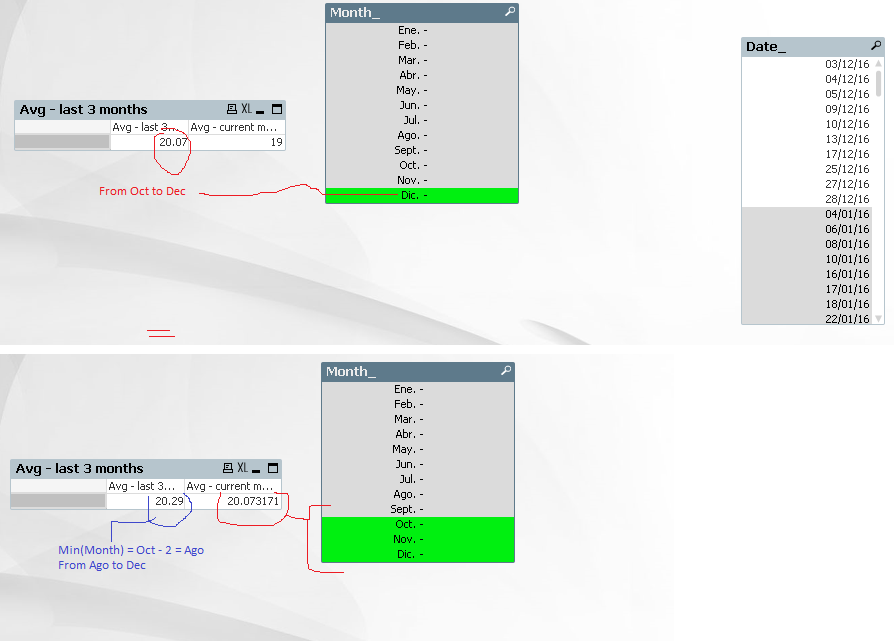
Hi, AVG Sales of the last 3 Months
Script:
SET ThousandSep=',';
SET DecimalSep='.';
SET MoneyThousandSep=',';
SET MoneyDecimalSep='.';
SET MoneyFormat='$#,##0.00;-$#,##0.00';
SET TimeFormat='h:mm:ss TT';
SET DateFormat='DD/MM/YY';
SET TimestampFormat='DD/MM/YY h:mm:ss[.fff] TT';
SET MonthNames='Ene.;Feb.;Mar.;Abr.;May.;Jun.;Jul.;Ago.;Sept.;Oct.;Nov.;Dic.';
SET DayNames='lun.;mar.;mié.;jue.;vie.;sáb.;dom.';
//Change Date <----field for Date_
Table:
LOAD * INLINE [
Date_, Sales
04/01/16, 26
06/01/16, 17
08/01/16, 19
......................
];
//add field --> NumDate
Join(Table)load
Date_,
Num(Date_) as NumDate,
Month(Date_)as Month_
Resident Table;
Graphic:
//without dimension, only expression...
//Edit: but you can add this calculated dimension
Dimension:
=Month($(=max(NumDate)))
Expression:
AVG({1<
NumDate={$(='">= ' & $(=Num(MonthStart(AddMonths(min(Num(Date_)),-2)))) & ' <= ' & $(=floor(num(max(Date_)))) &'"')}
>} Sales)