Unlock a world of possibilities! Login now and discover the exclusive benefits awaiting you.
- Qlik Community
- :
- All Forums
- :
- QlikView App Dev
- :
- Re: Last Three (3) Months Results of Selected Valu...
- Subscribe to RSS Feed
- Mark Topic as New
- Mark Topic as Read
- Float this Topic for Current User
- Bookmark
- Subscribe
- Mute
- Printer Friendly Page
- Mark as New
- Bookmark
- Subscribe
- Mute
- Subscribe to RSS Feed
- Permalink
- Report Inappropriate Content
Last Three (3) Months Results of Selected Value
Hi All,
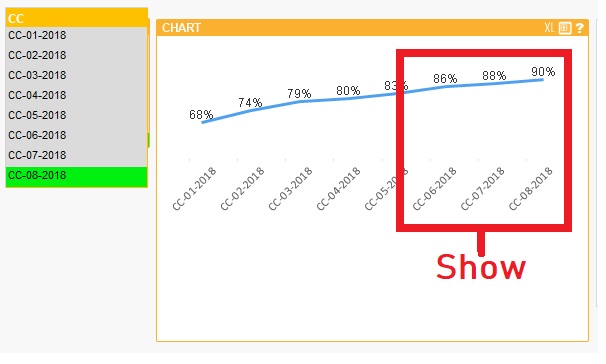
I want to create a Line Graph but in that I have to show 'Current Month' and 'Previous Two Months' but the problem is that I have Months in a string format like in below table and I am unable to filter it on the basis of List Box Value.
| Month |
|---|
| CC-01-2018 |
| CC-02-2018 |
| CC-03-2018 |
| CC-04-2018 |
| CC-05-2018 |
I have tried storing Mid(Month) value in a variable then applied an Action on Sheet Properties but not succeeded.
Please share any approach how can i achieve this?
WHAT I NEED TO SHOW:

Accepted Solutions
- Mark as New
- Bookmark
- Subscribe
- Mute
- Subscribe to RSS Feed
- Permalink
- Report Inappropriate Content
Create a small extra table in the script:
AsOfTable:
LOAD * INLINE [
Month_AsOf,Month
CC-01-2018,CC-01-2018
CC-01-2018,CC-11-2017
CC-01-2018,CC-12-2017
CC-02-2018,CC-01-2018
CC-02-2018,CC-02-2018
CC-02-2018,CC-12-2017
CC-03-2018,CC-01-2018
CC-03-2018,CC-02-2018
CC-03-2018,CC-03-2018
CC-04-2018,CC-02-2018
CC-04-2018,CC-03-2018
CC-04-2018,CC-04-2018
CC-05-2018,CC-04-2018
CC-05-2018,CC-05-2018
CC-05-2018,CC-05-2018
];
This will create a field Month_AsOf that will be linked to the three last month values. Use this Month_AsOf field as dimension in your line chart instead of the Month field.
talk is cheap, supply exceeds demand
- Mark as New
- Bookmark
- Subscribe
- Mute
- Subscribe to RSS Feed
- Permalink
- Report Inappropriate Content
I would try a calculated Dimension like
if (date#(right(Month,3,7),'MM-YYYY') > date(addmonths(today(),-3),'MM-YYYY'), Month)
maybe you Need to Format These Dates as they must have same format
- Mark as New
- Bookmark
- Subscribe
- Mute
- Subscribe to RSS Feed
- Permalink
- Report Inappropriate Content
Perhaps this document helps: Calculating rolling n-period totals, averages or other aggregations
talk is cheap, supply exceeds demand
- Mark as New
- Bookmark
- Subscribe
- Mute
- Subscribe to RSS Feed
- Permalink
- Report Inappropriate Content
should i need to change 'CC-01-2018' to '01-2018' ?
- Mark as New
- Bookmark
- Subscribe
- Mute
- Subscribe to RSS Feed
- Permalink
- Report Inappropriate Content
if you donot Need the CC in your x-axes you may do that, but then you Need to modify my expression
my Expression only takes the right characters (only seven roght) to compar them
if your month would contain only mm-yyyy calculated dimesnion could be
if (date#(Month,'MM-YYYY') > date(addmonths(today(),-3),'MM-YYYY'), Month)
in your x-axes you would see only MM-YYYY
- Mark as New
- Bookmark
- Subscribe
- Mute
- Subscribe to RSS Feed
- Permalink
- Report Inappropriate Content
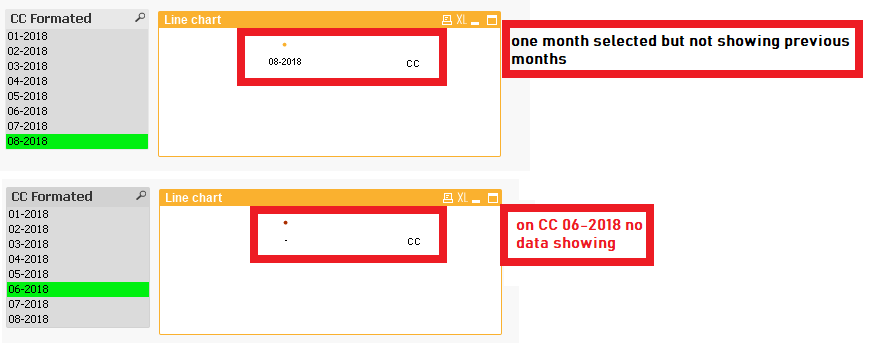
I have made the changes by using ApplyMap() as below:
CCFormat:
MAPPING LOAD * INLINE [
CC, CCFormat
CC-01-2018, 01-2018
CC-02-2018, 02-2018
CC-03-2018, 03-2018
CC-04-2018, 04-2018
CC-05-2018, 05-2018
CC-06-2018, 06-2018
CC-07-2018, 07-2018
CC-08-2018, 08-2018
];
But changes not worked as expected:

- Mark as New
- Bookmark
- Subscribe
- Mute
- Subscribe to RSS Feed
- Permalink
- Report Inappropriate Content
Create a small extra table in the script:
AsOfTable:
LOAD * INLINE [
Month_AsOf,Month
CC-01-2018,CC-01-2018
CC-01-2018,CC-11-2017
CC-01-2018,CC-12-2017
CC-02-2018,CC-01-2018
CC-02-2018,CC-02-2018
CC-02-2018,CC-12-2017
CC-03-2018,CC-01-2018
CC-03-2018,CC-02-2018
CC-03-2018,CC-03-2018
CC-04-2018,CC-02-2018
CC-04-2018,CC-03-2018
CC-04-2018,CC-04-2018
CC-05-2018,CC-04-2018
CC-05-2018,CC-05-2018
CC-05-2018,CC-05-2018
];
This will create a field Month_AsOf that will be linked to the three last month values. Use this Month_AsOf field as dimension in your line chart instead of the Month field.
talk is cheap, supply exceeds demand
- Mark as New
- Bookmark
- Subscribe
- Mute
- Subscribe to RSS Feed
- Permalink
- Report Inappropriate Content
Hi gwassenaar
I have updated my QVD with below table and following result showing, the filtration is not working properly:
When i select:
CC-08-2018 it shoes = CC-08-2018
CC-07-2018 it shoes = CC-07-2018 and CC-08-2018
CC-06-2018 it shoes = CC-06-2018, CC-07-2018 and CC-08-2018
| AsOfTable: |
| LOAD * INLINE [ |
| Month_AsOf,CCID |
| CC-06-2018,CC-04-2018 |
| CC-06-2018,CC-05-2018 |
| CC-06-2018,CC-06-2018 |
| CC-07-2018,CC-05-2018 |
| CC-07-2018,CC-06-2018 |
| CC-07-2018,CC-07-2018 |
| CC-08-2018,CC-06-2018 |
| CC-08-2018,CC-07-2018 |
| CC-08-2018,CC-08-2018 |
| ]; |

- Mark as New
- Bookmark
- Subscribe
- Mute
- Subscribe to RSS Feed
- Permalink
- Report Inappropriate Content
Make the selection in the AsOf field instead.
talk is cheap, supply exceeds demand
- Mark as New
- Bookmark
- Subscribe
- Mute
- Subscribe to RSS Feed
- Permalink
- Report Inappropriate Content
Great, its working!
Thanks Gysbert!