Unlock a world of possibilities! Login now and discover the exclusive benefits awaiting you.
- Qlik Community
- :
- All Forums
- :
- QlikView App Dev
- :
- Legend does not display when only one value in dim...
- Subscribe to RSS Feed
- Mark Topic as New
- Mark Topic as Read
- Float this Topic for Current User
- Bookmark
- Subscribe
- Mute
- Printer Friendly Page
- Mark as New
- Bookmark
- Subscribe
- Mute
- Subscribe to RSS Feed
- Permalink
- Report Inappropriate Content
Legend does not display when only one value in dimension
I have created a simple self-contained test project to demonstrate this issue.
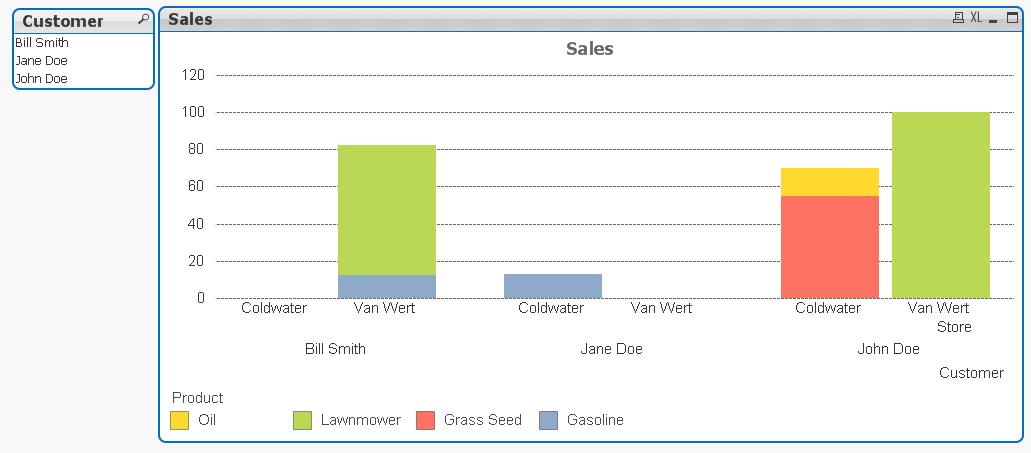
I have a stacked bar chart with 3 dimensions: Customer, Store, and Product. The following picture shows the chart appearing correctly with a legend shown on Product with a different bar segment color for each product shown on the chart.

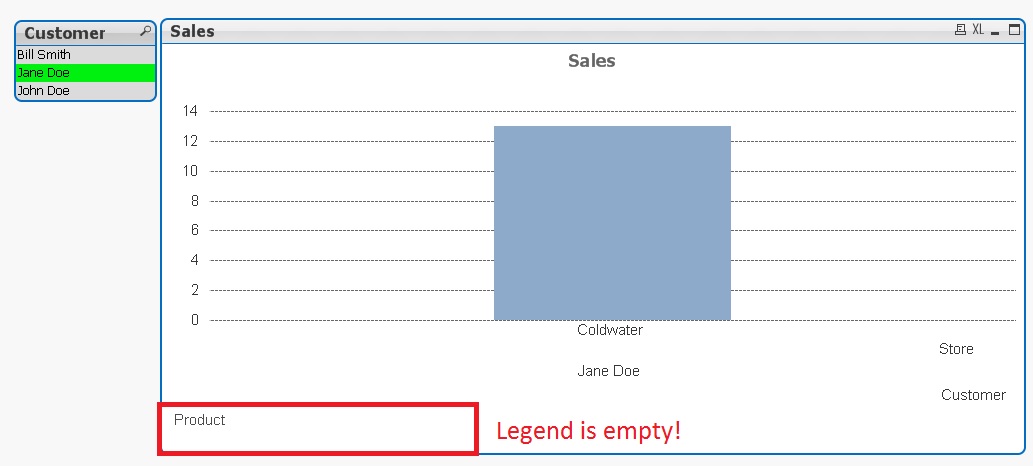
However, when I select the customer 'Jane Doe' there is only one Product value to display. When I do this the Product Legend is empty and I can't tell which product I am looking at because I don't know which product the bar represents. The below picture shows this, with my annotations added in red to highlight the issue.

What makes this even more strange is if I click on the bar chart's caption to make the chart 'active' then the Legend populates showing that blue represents the product 'Gasoline'. However, if I then save the QVW file, the legend again goes blank.
Any ideas on what causes this, and know of any workarounds?
Message was edited by: Jack Diller (attached sample app: MissingLegend.qvw)
- « Previous Replies
-
- 1
- 2
- Next Replies »
- Mark as New
- Bookmark
- Subscribe
- Mute
- Subscribe to RSS Feed
- Permalink
- Report Inappropriate Content
Apparently, if you just press Ctrl-Shift once with your Chart (and 'Jane Doe') selected, your legend becomes visible again. No need to scale anything.
Miond you: be careful with the Ctrl-Shift way of reordering chart parts. It will offer nice effects, but also a good fight to get it to work like you want (more often than once)
- Mark as New
- Bookmark
- Subscribe
- Mute
- Subscribe to RSS Feed
- Permalink
- Report Inappropriate Content
Thanks Sunny. I see that you expanded the legend vertically and that seems to have fixed it. This still seems like a QlikView bug to me, but what you did is a good solution for what I need.
- « Previous Replies
-
- 1
- 2
- Next Replies »