Unlock a world of possibilities! Login now and discover the exclusive benefits awaiting you.
- Qlik Community
- :
- All Forums
- :
- QlikView App Dev
- :
- Limit Dimensions
- Subscribe to RSS Feed
- Mark Topic as New
- Mark Topic as Read
- Float this Topic for Current User
- Bookmark
- Subscribe
- Mute
- Printer Friendly Page
- Mark as New
- Bookmark
- Subscribe
- Mute
- Subscribe to RSS Feed
- Permalink
- Report Inappropriate Content
Limit Dimensions
How to choose the first 5-10 dimention in a bar chart?
Say it has 20 dimentions, I want the 5th-10th ones. Is there any way to do it?
Thank you.
- Tags:
- new_to_qlikview
- « Previous Replies
-
- 1
- 2
- Next Replies »
- Mark as New
- Bookmark
- Subscribe
- Mute
- Subscribe to RSS Feed
- Permalink
- Report Inappropriate Content
U mean the 20 dimension fields or 20 values for a single dimension? explain more clearly.
- Mark as New
- Bookmark
- Subscribe
- Mute
- Subscribe to RSS Feed
- Permalink
- Report Inappropriate Content
Hi,
Based on what criteria you need to filter this?
Regards
ASHFAQ
- Mark as New
- Bookmark
- Subscribe
- Mute
- Subscribe to RSS Feed
- Permalink
- Report Inappropriate Content
Hi Anna,
Is there any criteria on which the dimension is sorted?
like assending order or descending sum(sales) or anything like this?
A screenshot will be helpful.
Regards
KC
KC
- Mark as New
- Bookmark
- Subscribe
- Mute
- Subscribe to RSS Feed
- Permalink
- Report Inappropriate Content
Easiest way would be to enable X-Axis scrolling when number of items exceed 6 (under Presentation tab), and let the users scroll themselves until only positions 5-10 are shown 😉
If you want to hard-limit the display to only those positions, it's more complicated.
- Mark as New
- Bookmark
- Subscribe
- Mute
- Subscribe to RSS Feed
- Permalink
- Report Inappropriate Content
U can use Calculated Dimension like this:
Here Product is the Dimension
and based on sum(price) i m ranking the product and taking only the dimension values falling between rank 5 to 10
=if(aggr(rank(sum(price)),Product) >= 5 and aggr(rank(sum(price)),Product) <= 10 ,Product)
- Mark as New
- Bookmark
- Subscribe
- Mute
- Subscribe to RSS Feed
- Permalink
- Report Inappropriate Content
One way of doing this is through a calculated dimension where you use a combination of AGGR and RANK.
E.g.
=IF(
AGGR(RANK(SUM(Amount),4),Dimension)>=5 AND AGGR(RANK(SUM(Amount),4),Dimension)<=10 ,
Dimension
)
See attached example.
Kind regards
Niklas
- Mark as New
- Bookmark
- Subscribe
- Mute
- Subscribe to RSS Feed
- Permalink
- Report Inappropriate Content
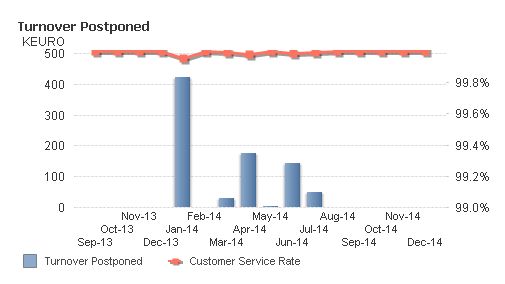
I mean the dimension fields for a single dimension.
Just want Jan-14 to Sep-14.
- Mark as New
- Bookmark
- Subscribe
- Mute
- Subscribe to RSS Feed
- Permalink
- Report Inappropriate Content
Ya u can achieve this in multiple ways:
1. When i see the chart,it seems the other dimension values are having null values- just go to Presentation tab enable the Suppress the null and Suppress the zero values options.
- Mark as New
- Bookmark
- Subscribe
- Mute
- Subscribe to RSS Feed
- Permalink
- Report Inappropriate Content
Hi Anna,
What is there in expression?
Iam asuming it is sum(Turnover Postponed)
Then try like this in expression:
sum({Date={'>= Jan-14 <= Sep-14'}>}[Turnover Postponed])
sum({Date={'>= Jan-14 <= Sep-14'}>}[Customer Serivce rate])
Regards
KC
KC
- « Previous Replies
-
- 1
- 2
- Next Replies »