Unlock a world of possibilities! Login now and discover the exclusive benefits awaiting you.
- Qlik Community
- :
- All Forums
- :
- QlikView App Dev
- :
- Re: Limiting values displayed in a bubble chart
Options
- Subscribe to RSS Feed
- Mark Topic as New
- Mark Topic as Read
- Float this Topic for Current User
- Bookmark
- Subscribe
- Mute
- Printer Friendly Page
Turn on suggestions
Auto-suggest helps you quickly narrow down your search results by suggesting possible matches as you type.
Showing results for
Anonymous
Not applicable
2016-01-15
04:58 PM
- Mark as New
- Bookmark
- Subscribe
- Mute
- Subscribe to RSS Feed
- Permalink
- Report Inappropriate Content
Limiting values displayed in a bubble chart
Can the values displayed in a bubble chart limited? I have the following bubble chart:
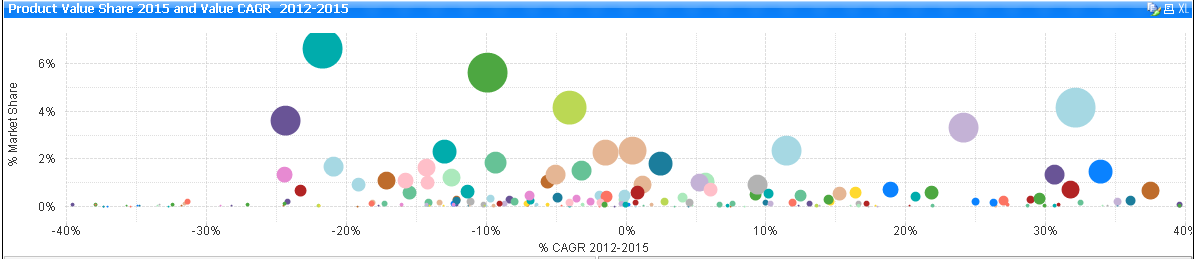
I need to reduce the number of bubbles in the chart. I have tried 'Dimension Limits' which i think is not the the way to do it. Let's say i want to show the top 10 values per dimension, what expression can i use for this in the calculated dimension? Can anyone assist?
Regards.
567 Views
1 Solution
Accepted Solutions
Anonymous
Not applicable
2016-01-15
05:57 PM
Author
- Mark as New
- Bookmark
- Subscribe
- Mute
- Subscribe to RSS Feed
- Permalink
- Report Inappropriate Content
After some Googling, i used the following expression and this is what i was looking for.

472 Views
1 Reply
Anonymous
Not applicable
2016-01-15
05:57 PM
Author
- Mark as New
- Bookmark
- Subscribe
- Mute
- Subscribe to RSS Feed
- Permalink
- Report Inappropriate Content
After some Googling, i used the following expression and this is what i was looking for.
473 Views