Unlock a world of possibilities! Login now and discover the exclusive benefits awaiting you.
- Qlik Community
- :
- All Forums
- :
- QlikView App Dev
- :
- Re: Line Chart Formatting Issues For Displaying 1 ...
- Subscribe to RSS Feed
- Mark Topic as New
- Mark Topic as Read
- Float this Topic for Current User
- Bookmark
- Subscribe
- Mute
- Printer Friendly Page
- Mark as New
- Bookmark
- Subscribe
- Mute
- Subscribe to RSS Feed
- Permalink
- Report Inappropriate Content
Line Chart Formatting Issues For Displaying 1 Expression - QlikView 12
Hello,
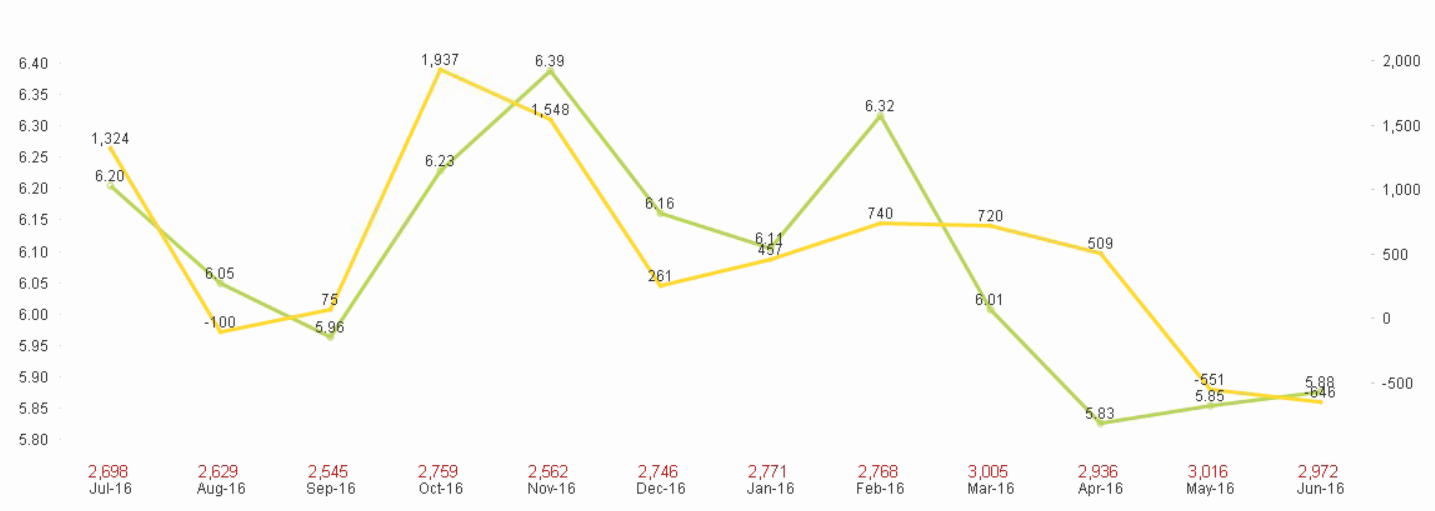
When I have 2 or more expressions selected to be displayed the following aspects work as intended.
1. The legend displays the titles of the expressions
2. The lines are represented as lines
3. The X-Axis count numbers remain aligned horizontally
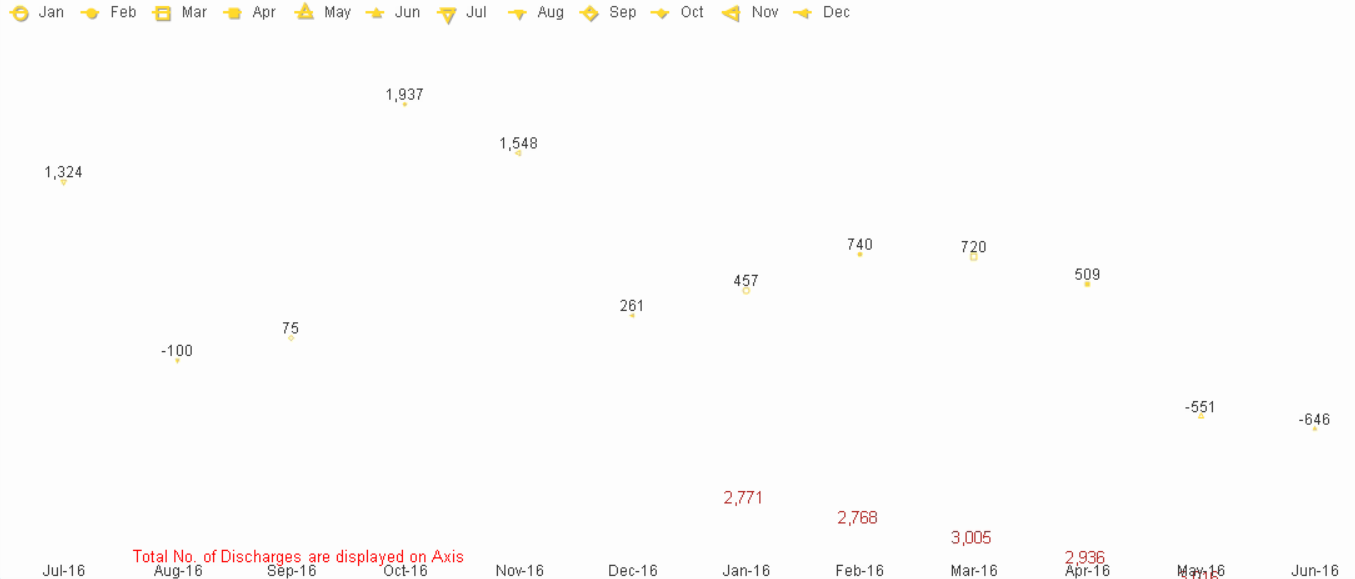
When I have 1 Expression selected to be displayed the 3 aspects of the line chart visual change.
1. The legend displays the months instead of the expression title
2. The lines are no longer represented and just show the circles
3. The X-Axis count numbers are no longer aligned
Can you help me address these issues?
Accepted Solutions
- Mark as New
- Bookmark
- Subscribe
- Mute
- Subscribe to RSS Feed
- Permalink
- Report Inappropriate Content
I found the issue.
Within the line chart "Dimension" Tab, I had multiple used dimensions. When I limited to one, all three issues were resolved.
Thanks,
- Mark as New
- Bookmark
- Subscribe
- Mute
- Subscribe to RSS Feed
- Permalink
- Report Inappropriate Content
It seems like this should be quite simple to fix, can you share a QVD?
I see you have discharges data so guessing it is sensitive and you might want to scramble some fields before sharing
- Mark as New
- Bookmark
- Subscribe
- Mute
- Subscribe to RSS Feed
- Permalink
- Report Inappropriate Content
I found the issue.
Within the line chart "Dimension" Tab, I had multiple used dimensions. When I limited to one, all three issues were resolved.
Thanks,