Unlock a world of possibilities! Login now and discover the exclusive benefits awaiting you.
- Qlik Community
- :
- All Forums
- :
- QlikView App Dev
- :
- Line Chart, different and multiple expression
- Subscribe to RSS Feed
- Mark Topic as New
- Mark Topic as Read
- Float this Topic for Current User
- Bookmark
- Subscribe
- Mute
- Printer Friendly Page
- Mark as New
- Bookmark
- Subscribe
- Mute
- Subscribe to RSS Feed
- Permalink
- Report Inappropriate Content
Line Chart, different and multiple expression
Hello again community.
I attach a file, where i have 4 line chart in different graphics, each one have a different expression whit different variables.
I wanto to show in a 1 graph the 4 lines.
Any idea? what should i do?
Thanks
Accepted Solutions
- Mark as New
- Bookmark
- Subscribe
- Mute
- Subscribe to RSS Feed
- Permalink
- Report Inappropriate Content
Check attached - You dont need the calculated Dim. Instead just use Set Analysis for the Expressions. PFA. Second TAB for the new chart.
- Mark as New
- Bookmark
- Subscribe
- Mute
- Subscribe to RSS Feed
- Permalink
- Report Inappropriate Content
Check attached - You dont need the calculated Dim. Instead just use Set Analysis for the Expressions. PFA. Second TAB for the new chart.
- Mark as New
- Bookmark
- Subscribe
- Mute
- Subscribe to RSS Feed
- Permalink
- Report Inappropriate Content
One dimension with 4 expression?
- Mark as New
- Bookmark
- Subscribe
- Mute
- Subscribe to RSS Feed
- Permalink
- Report Inappropriate Content
Convert your expressions to below.
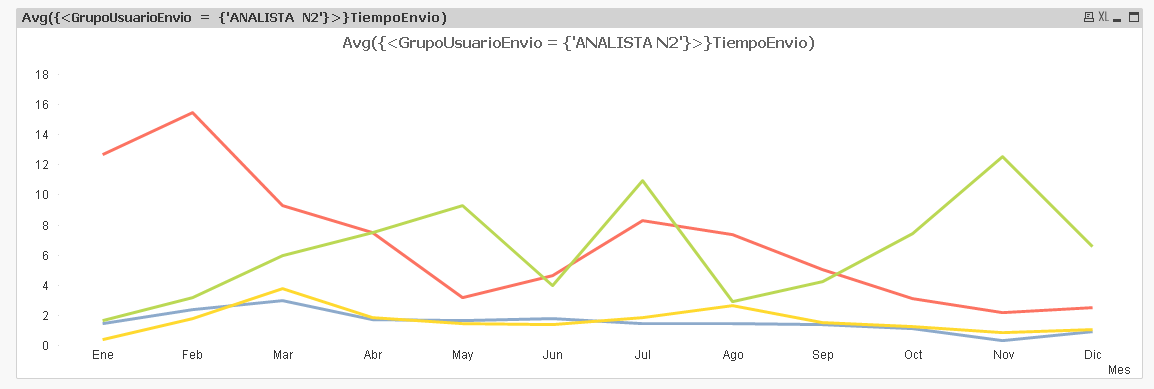
1. (Avg({<GrupoUsuarioEnvio = {"ANALISTA N2"}>}TiempoEnvio))
2.(AVG({<GrupoUsuarioRespuesta={"PEX"}>}TiempoRetorno))
3. (AVG({<GrupoUsuarioRespuesta={"OPERACIONES"}>}TiempoRetorno))
4.(Avg({<GrupoUsuarioEnvio={"ANALISTA N2"}>}Aggr(FirstSortedValue(TiempoConclusion, -Fecha_Respuesta), GrupoUsuarioEnvio, NumProcesso)))
Regards,
Kaushik Solanki
- Mark as New
- Bookmark
- Subscribe
- Mute
- Subscribe to RSS Feed
- Permalink
- Report Inappropriate Content
Thanks to all users. I was used a stament "IF", because of that my chart was empty.

- Mark as New
- Bookmark
- Subscribe
- Mute
- Subscribe to RSS Feed
- Permalink
- Report Inappropriate Content
Always Prefer Set analysis over If statement. That will help you in improving the performance of your application.
Regards,
Kaushik Solanki