Unlock a world of possibilities! Login now and discover the exclusive benefits awaiting you.
- Qlik Community
- :
- All Forums
- :
- QlikView App Dev
- :
- Line Chart
- Subscribe to RSS Feed
- Mark Topic as New
- Mark Topic as Read
- Float this Topic for Current User
- Bookmark
- Subscribe
- Mute
- Printer Friendly Page
- Mark as New
- Bookmark
- Subscribe
- Mute
- Subscribe to RSS Feed
- Permalink
- Report Inappropriate Content
Line Chart
Hi All,
I have line chart where the dimension values are static values (A,B,C,D,) and i have 4 expressions. there is no relation between the dimension values and expression values. how can i plot the graph.
Dimension values
A
B
C
D
Expressions
Sum(Answer1+Answer2)
Sum(Answer3+Answer4)
Sum(Answer5+Answer6)
Sum(Answer7+Answer8)
So 'A' in x axis should display Sum(Answer1+Answer2) in y axis
'B' in x axis should display Sum(Answer1+Answer2) in y axis
'C' in x axis should display Sum(Answer1+Answer2) in y axis
'D' n x axis should display Sum(Answer1+Answer2) in y axis
Please help.
- « Previous Replies
-
- 1
- 2
- Next Replies »
Accepted Solutions
- Mark as New
- Bookmark
- Subscribe
- Mute
- Subscribe to RSS Feed
- Permalink
- Report Inappropriate Content
- Mark as New
- Bookmark
- Subscribe
- Mute
- Subscribe to RSS Feed
- Permalink
- Report Inappropriate Content
Hi,
If u don't have the relation between expressions and dimension values then, I don't think u can create line chart because it displays no data to display but still if u want to have then, u need to create a new field which can build a relation between them.
I m not sure about it but u can give a try.
- Mark as New
- Bookmark
- Subscribe
- Mute
- Subscribe to RSS Feed
- Permalink
- Report Inappropriate Content
Why a Line Chart? For Line Chart you need an dimension. Did you mean maybe bar chart?
- Mark as New
- Bookmark
- Subscribe
- Mute
- Subscribe to RSS Feed
- Permalink
- Report Inappropriate Content
Hi,
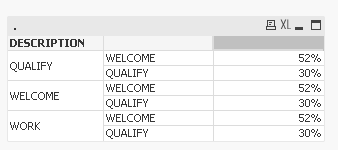
I tried it with pivot table also.
Dimension:
Description
Expression:
if ( SecondaryDimensionality()=1 , sum(Alt(Value,0))
, num(sum ({<DESCRIPTION={'WELCOME'}>} {<Questions={'Q1','Q2','Q3','Q4','Q5','Q6','Q7A','Q7B','Q8','Q9','Q10','Q11','Q12','Q13'}>}Alt(Value,0))/
count ({<DESCRIPTION={'WELCOME'}>}{<Questions={'Q1','Q2','Q3','Q4','Q5','Q6','Q7A','Q7B','Q8','Q9','Q10','Q11','Q12','Q13'}>} Value ),'0%' ))
if ( SecondaryDimensionality()=1 , sum(Alt(Value,0))
, num(sum ({<DESCRIPTION={'QUALIFY'}>}{<Questions={'Q13','Q14','Q15A','Q15B','Q15C','Q15D','Q15E','Q15F','Q15G','Q15H','Q15I','Q16','Q17','Q18','Q19','Q20','Q21'}>}Alt(Value,0))/
count ({<DESCRIPTION={'QUALIFY'}>}{<Questions={'Q13','Q14','Q15A','Q15B','Q15C','Q15D','Q15E','Q15F','Q15G','Q15H','Q15I','Q16','Q17','Q18','Q19','Q20','Q21'}>} Value ),'0%' ))
Qualify value should display only Qualify and Welcome should display only welcome. But i couldn't do that.
- Mark as New
- Bookmark
- Subscribe
- Mute
- Subscribe to RSS Feed
- Permalink
- Report Inappropriate Content
Try this:
if( DESCRIPTION = 'WELCOME'
,
( SecondaryDimensionality()=1 , sum(Alt(Value,0))
, num(sum ({<Questions={'Q1','Q2','Q3','Q4','Q5','Q6','Q7A','Q7B','Q8','Q9','Q10','Q11','Q12','Q13'}>}Alt(Value,0))/
count ({<Questions={'Q1','Q2','Q3','Q4','Q5','Q6','Q7A','Q7B','Q8','Q9','Q10','Q11','Q12','Q13'}>} Value ),'0%' ))
,
if ( SecondaryDimensionality()=1 , sum(Alt(Value,0))
, num(sum ({<Questions={'Q13','Q14','Q15A','Q15B','Q15C','Q15D','Q15E','Q15F','Q15G','Q15H','Q15I','Q16','Q17','Q18','Q19','Q20','Q21'}>}Alt(Value,0))/
count ({<Questions={'Q13','Q14','Q15A','Q15B','Q15C','Q15D','Q15E','Q15F','Q15G','Q15H','Q15I','Q16','Q17','Q18','Q19','Q20','Q21'}>} Value ),'0%' ))
)
- Mark as New
- Bookmark
- Subscribe
- Mute
- Subscribe to RSS Feed
- Permalink
- Report Inappropriate Content
 I tried but still not getting the proper graph.
- Mark as New
- Bookmark
- Subscribe
- Mute
- Subscribe to RSS Feed
- Permalink
- Report Inappropriate Content
please upload you qv file also without data.
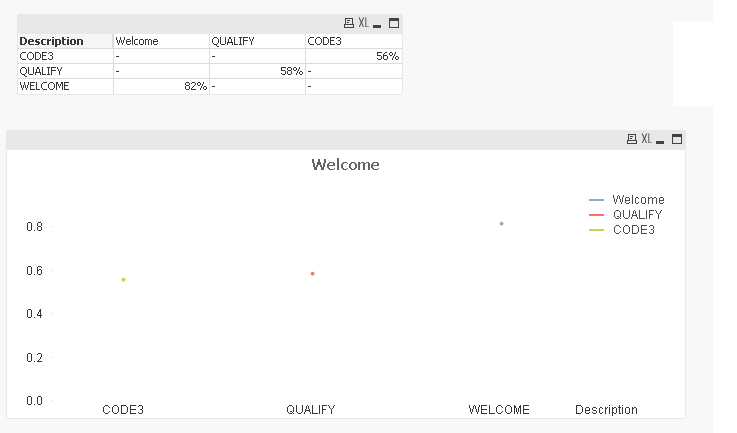
I see you have 3 formulas assigned to your dimension. This can be only three points, without line.
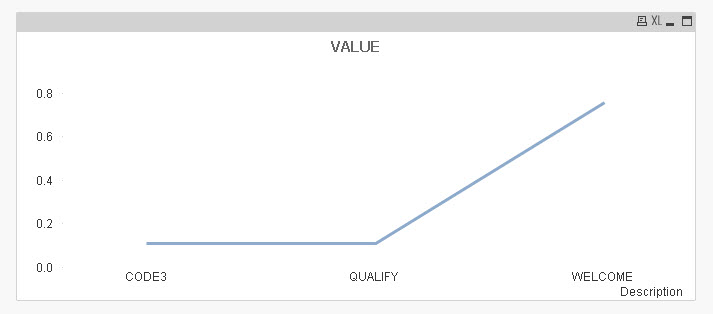
You must only have 1 formula and exception with if(description='welcome') etc...
- Mark as New
- Bookmark
- Subscribe
- Mute
- Subscribe to RSS Feed
- Permalink
- Report Inappropriate Content
Please find the attached qv file.
Thank you
- Mark as New
- Bookmark
- Subscribe
- Mute
- Subscribe to RSS Feed
- Permalink
- Report Inappropriate Content
- Mark as New
- Bookmark
- Subscribe
- Mute
- Subscribe to RSS Feed
- Permalink
- Report Inappropriate Content
Thanks a lot
- « Previous Replies
-
- 1
- 2
- Next Replies »