Unlock a world of possibilities! Login now and discover the exclusive benefits awaiting you.
- Qlik Community
- :
- All Forums
- :
- QlikView App Dev
- :
- Re: Line Graph Help
- Subscribe to RSS Feed
- Mark Topic as New
- Mark Topic as Read
- Float this Topic for Current User
- Bookmark
- Subscribe
- Mute
- Printer Friendly Page
- Mark as New
- Bookmark
- Subscribe
- Mute
- Subscribe to RSS Feed
- Permalink
- Report Inappropriate Content
Line Graph Help
Hey guys,
I have a line graph that I am trying to show items produced per month. Currently it only shows Jan through September because we haven't collected any data for the rest of the year (Oct, Nov, Dec). I was curious to see how I can get those months to show up anyways with no data collected so far. Here is the current formula I am using to show the total per month.
Sum({$<Program_Dash={'Mechanical Inspection'}, Status_Dash={'Completed'}, Year = {"$(=Year(FirstWorkDate(ConvertToLocalTime(Date(now()), 'GMT-05:00'),1,$(vHolidays))))"}>} Processed_Dash)
- « Previous Replies
- Next Replies »
- Mark as New
- Bookmark
- Subscribe
- Mute
- Subscribe to RSS Feed
- Permalink
- Report Inappropriate Content
I believe you have to generate Master Script to get missing Dates thru Months until whole year of months then in front end you have to tick the Suppress from Presentation tab to show the null values in Graph..
- Mark as New
- Bookmark
- Subscribe
- Mute
- Subscribe to RSS Feed
- Permalink
- Report Inappropriate Content
I've never used this before. Any tips?
- Mark as New
- Bookmark
- Subscribe
- Mute
- Subscribe to RSS Feed
- Permalink
- Report Inappropriate Content
- Mark as New
- Bookmark
- Subscribe
- Mute
- Subscribe to RSS Feed
- Permalink
- Report Inappropriate Content
what is the dimension you are using?
month ?
if so
can you please go to the presentation tab and un-check suppress zero values.
regards
Pradosh
- Mark as New
- Bookmark
- Subscribe
- Mute
- Subscribe to RSS Feed
- Permalink
- Report Inappropriate Content
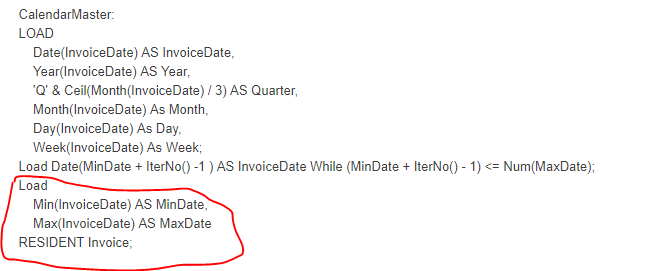
Try this Master Calendar Generation Script
- Mark as New
- Bookmark
- Subscribe
- Mute
- Subscribe to RSS Feed
- Permalink
- Report Inappropriate Content
Also,
After you create the master calendar script,
use the 'month' field as dimension and and un-check suppress zero values in the Presentation tab.
In the expression,
Sum({$<Program_Dash={'Mechanical Inspection'}, Status_Dash={'Completed'}>} Processed_Dash)
Regards,
Pratik
- Mark as New
- Bookmark
- Subscribe
- Mute
- Subscribe to RSS Feed
- Permalink
- Report Inappropriate Content
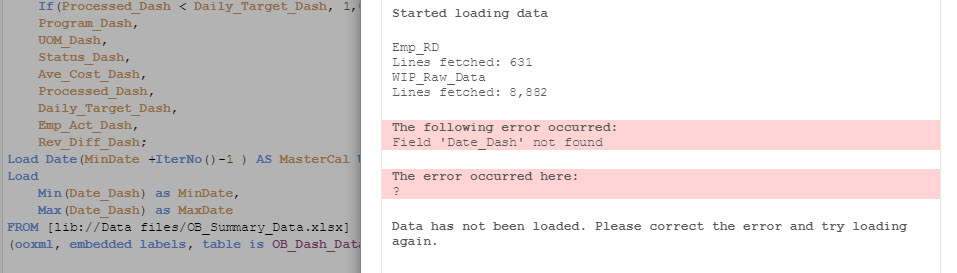
This is where I am at on this. I am getting an error on the From part.
LOAD
Date_Dash,
Date(Date_Dash) as Date_MS,
Month(Date_Dash) as Month,
Num(Month(Date_Dash)) as MonthNum,
Year(Date_Dash) as Year,
MakeDate(year(Date_Dash)) as vCY,
MakeDate(month(Date_Dash)) as vCM,
Min(Date_Dash) AS MinDate,
Max(Date_Dash) as MaxDate,
If(Processed_Dash < Daily_Target_Dash, 1,0) as Daily_Target_Flag,
Program_Dash,
UOM_Dash,
Status_Dash,
Ave_Cost_Dash,
Processed_Dash,
Daily_Target_Dash,
Emp_Act_Dash,
Rev_Diff_Dash;
Load Date(MinDate +IterNo()-1 ) AS MasterCal While (MinDate + IterNo() -1) <= Num(MaxDate);
FROM [lib://Data files/OB_Summary_Data.xlsx]
(ooxml, embedded labels, table is OB_Dash_Data);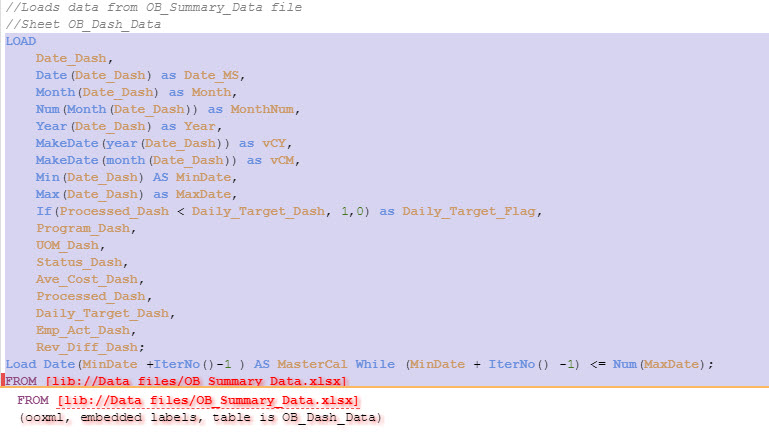
- Mark as New
- Bookmark
- Subscribe
- Mute
- Subscribe to RSS Feed
- Permalink
- Report Inappropriate Content
You missed this part?
- Mark as New
- Bookmark
- Subscribe
- Mute
- Subscribe to RSS Feed
- Permalink
- Report Inappropriate Content
In the first attached, I added that to my original LOAD instead because I get this error when I try like that.
- « Previous Replies
- Next Replies »