Unlock a world of possibilities! Login now and discover the exclusive benefits awaiting you.
- Qlik Community
- :
- All Forums
- :
- QlikView App Dev
- :
- Line chart, 2 dimensions, 2 expressions
- Subscribe to RSS Feed
- Mark Topic as New
- Mark Topic as Read
- Float this Topic for Current User
- Bookmark
- Subscribe
- Mute
- Printer Friendly Page
- Mark as New
- Bookmark
- Subscribe
- Mute
- Subscribe to RSS Feed
- Permalink
- Report Inappropriate Content
Line chart, 2 dimensions, 2 expressions
Hi,
I'm a QlikView newbie and I've been trying to solve a problem...without any luck.
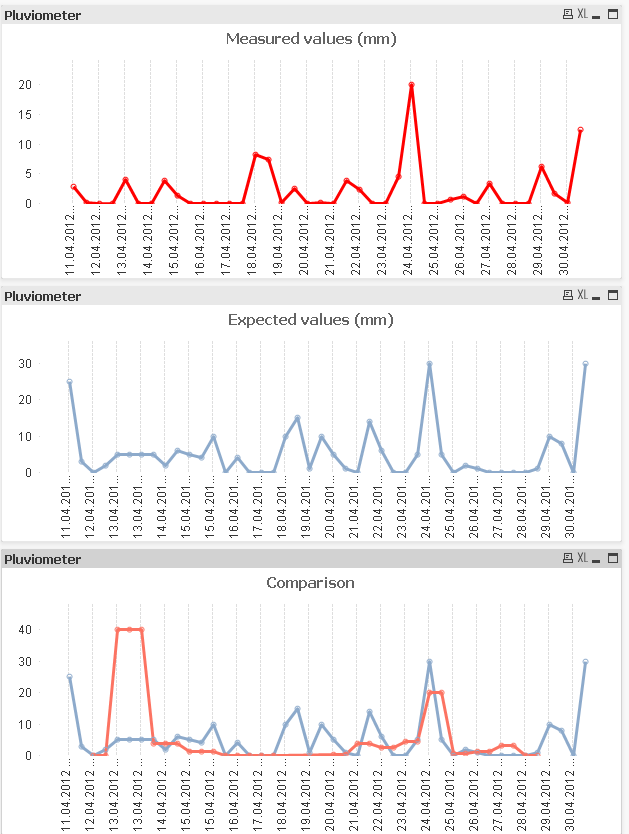
I have a line chart with 2 expressions showing respectively the expected amount of rainfall per day, and the real (measured) amount of rainfall per day.
I can correctly see just one of the two expressions at a time depending on which dimension I use.
If I use dimension called "date_expected", I can correctly see the line chart with expression = "expected_values"
If I use dimension called "date_measured", I can correctly see the line chart with expression = ''measured_values"
If I use both dimenions, on the graph one line is correct but the other is not.
In the attached image I used both dimensions (date_expected on top), as you can see from the last chart the measured_values are not correctly shown.
What I want is to (simply...) merge the first 2 graphs in one chart
Thanks in advance
Michel
Accepted Solutions
- Mark as New
- Bookmark
- Subscribe
- Mute
- Subscribe to RSS Feed
- Permalink
- Report Inappropriate Content
Are these 2 databases combined into one table in the script? Will the date measured and date expected be linkable? If the below is hard to understand can you post a copy of your script?
Measured Table:
date(datemeasured) as Datelink
Expected Table:
date(dateexpected) as Datelink.
- Mark as New
- Bookmark
- Subscribe
- Mute
- Subscribe to RSS Feed
- Permalink
- Report Inappropriate Content
You would need to use a calendar with either a new table for measured with the dates linked to a common date,
or the slower option of leaving the calendar unlinked and using an if statement like
Measured:
sum(if(date_measured=calendardate,measuredamount))
- Mark as New
- Bookmark
- Subscribe
- Mute
- Subscribe to RSS Feed
- Permalink
- Report Inappropriate Content
Michel, simplest way to do this, just have a single date field on the model.
- Mark as New
- Bookmark
- Subscribe
- Mute
- Subscribe to RSS Feed
- Permalink
- Report Inappropriate Content
I give you more in details
I fetch the data (expected and measured) from 2 different databases.
The column "data_measured" looks like this:
12.04.2012 09:15
12.04.2012 09:30
12.04.2012 09:45
12.04.2012 10:00...
Every 15 minutes there is a new measure. I group together these measures in two groups: amount of rain from midnight till noon and amount of rain from noon till midnight (for each day)
The column "data_expected" looks like this:
12.04.2012 00:00
12.04.2012 12:00
13.04.2012 00:00
13.04.2012 12:00...
Here we have 2 measures per day (each measure matches the two time slot mentioned above, midnight-noon, noon-midnight), so e.g. 12.04.2012 00:00 refers to the amount of rain between midnight and noon.
If I use the column "date" of measured_values as dimension for the expected_values I don't get a correct chart.
- Mark as New
- Bookmark
- Subscribe
- Mute
- Subscribe to RSS Feed
- Permalink
- Report Inappropriate Content
Can you please explain me better, what do you mean for "common date"?
Common date is a copy of "date_measured"?
The calendardate should be linked to "date_measured""?
I added some more explanation above about dates.
Thanks for the help!
- Mark as New
- Bookmark
- Subscribe
- Mute
- Subscribe to RSS Feed
- Permalink
- Report Inappropriate Content
Are these 2 databases combined into one table in the script? Will the date measured and date expected be linkable? If the below is hard to understand can you post a copy of your script?
Measured Table:
date(datemeasured) as Datelink
Expected Table:
date(dateexpected) as Datelink.
- Mark as New
- Bookmark
- Subscribe
- Mute
- Subscribe to RSS Feed
- Permalink
- Report Inappropriate Content
Hi, first you need link the 2 date fields, in this case only put the field date (containing values from date_measured and date_expected) as dimension.
Later use your 2 expressions:
Sum(expected_values)
Sum(measured_values)
Sorry for my bad english.
Regards.-
- Mark as New
- Bookmark
- Subscribe
- Mute
- Subscribe to RSS Feed
- Permalink
- Report Inappropriate Content
I linked the two data fields together as you can see from the solution.
Thanks everybody for your help!