Unlock a world of possibilities! Login now and discover the exclusive benefits awaiting you.
- Qlik Community
- :
- All Forums
- :
- QlikView App Dev
- :
- Line chart Multiple expressions and One line
- Subscribe to RSS Feed
- Mark Topic as New
- Mark Topic as Read
- Float this Topic for Current User
- Bookmark
- Subscribe
- Mute
- Printer Friendly Page
- Mark as New
- Bookmark
- Subscribe
- Mute
- Subscribe to RSS Feed
- Permalink
- Report Inappropriate Content
Line chart Multiple expressions and One line
Hello,
Is it possible to have in a line chart multiple expressions , one dimension in one line.
Expressions are ( sales N-3 ,sales N-2, sales N-1, budget N, sales N), dimension Year
please see the screenshot to better understand my needs
Thank You.
- Mark as New
- Bookmark
- Subscribe
- Mute
- Subscribe to RSS Feed
- Permalink
- Report Inappropriate Content
Can you please provide a screenshot with blue text boxes with yours description of dimensions and expressions? (they are under the chart)
- Mark as New
- Bookmark
- Subscribe
- Mute
- Subscribe to RSS Feed
- Permalink
- Report Inappropriate Content
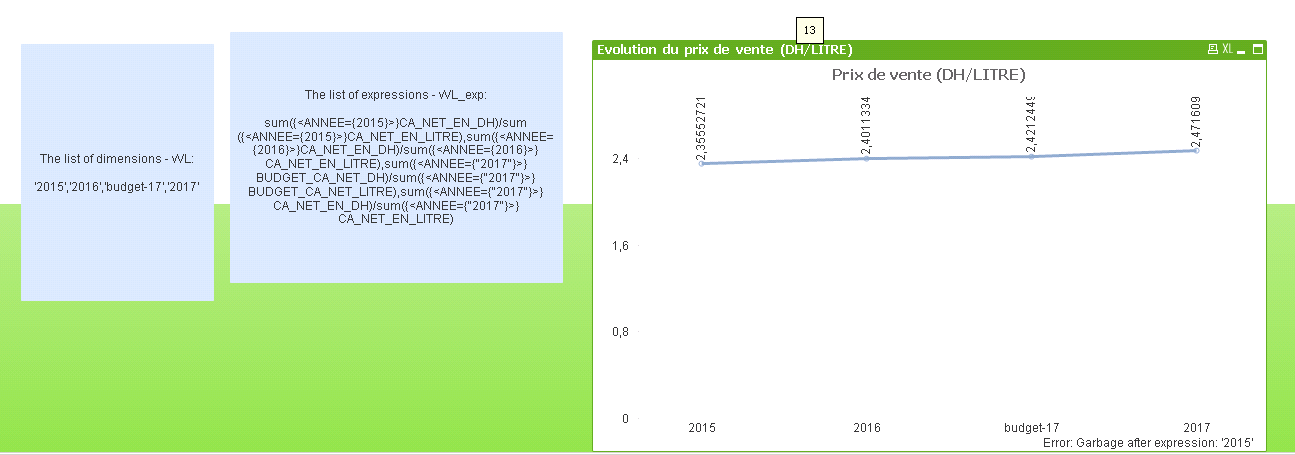
here is the screeshot, now its okey the budget is display but still have the error msg under the chart,don't know why
thank you so much
- Mark as New
- Bookmark
- Subscribe
- Mute
- Subscribe to RSS Feed
- Permalink
- Report Inappropriate Content
It's ok, some formulas gets this error but still works.
You can go to the Dimensions tab and set a Lable for ValueList() dimension, like "year" (as in my example was).
And I'm glad that you've got the result 😃 now you can do some cosmetics and add some years by changing this parameter:
{">$(=max(ANNEE)-3) <=$(=max(ANNEE)-1)"}
- Mark as New
- Bookmark
- Subscribe
- Mute
- Subscribe to RSS Feed
- Permalink
- Report Inappropriate Content
Thank you so much for your help.
All your answers were very richful.
Thank you.
- Mark as New
- Bookmark
- Subscribe
- Mute
- Subscribe to RSS Feed
- Permalink
- Report Inappropriate Content
Hi,
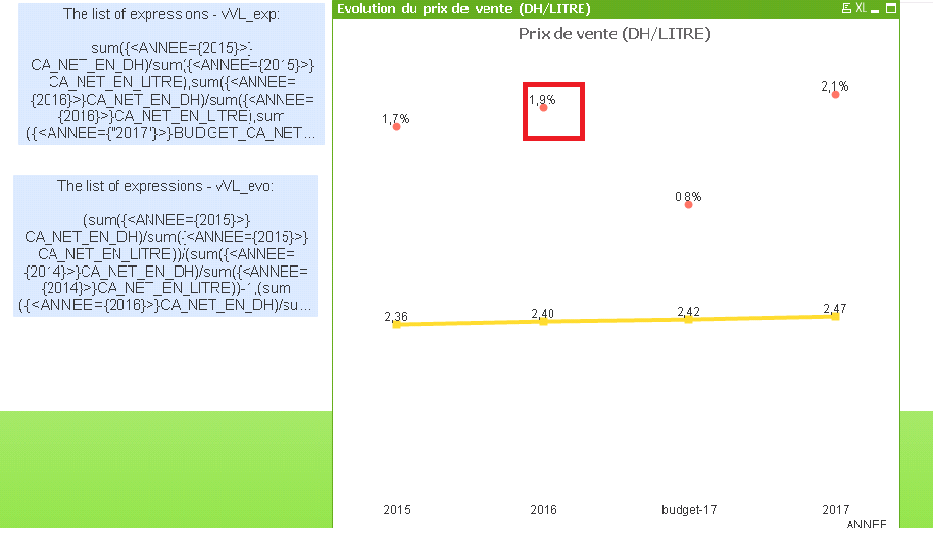
I have just one more question if you allow, is it possible to display in the chart the pourcentage highlighted in the screenhot , it represents the evolution from a year to another ( positive or negative).
Thank you so much for your help.
- Mark as New
- Bookmark
- Subscribe
- Mute
- Subscribe to RSS Feed
- Permalink
- Report Inappropriate Content
Hello!
You can do this with additional variable (I called it vVL_evo):
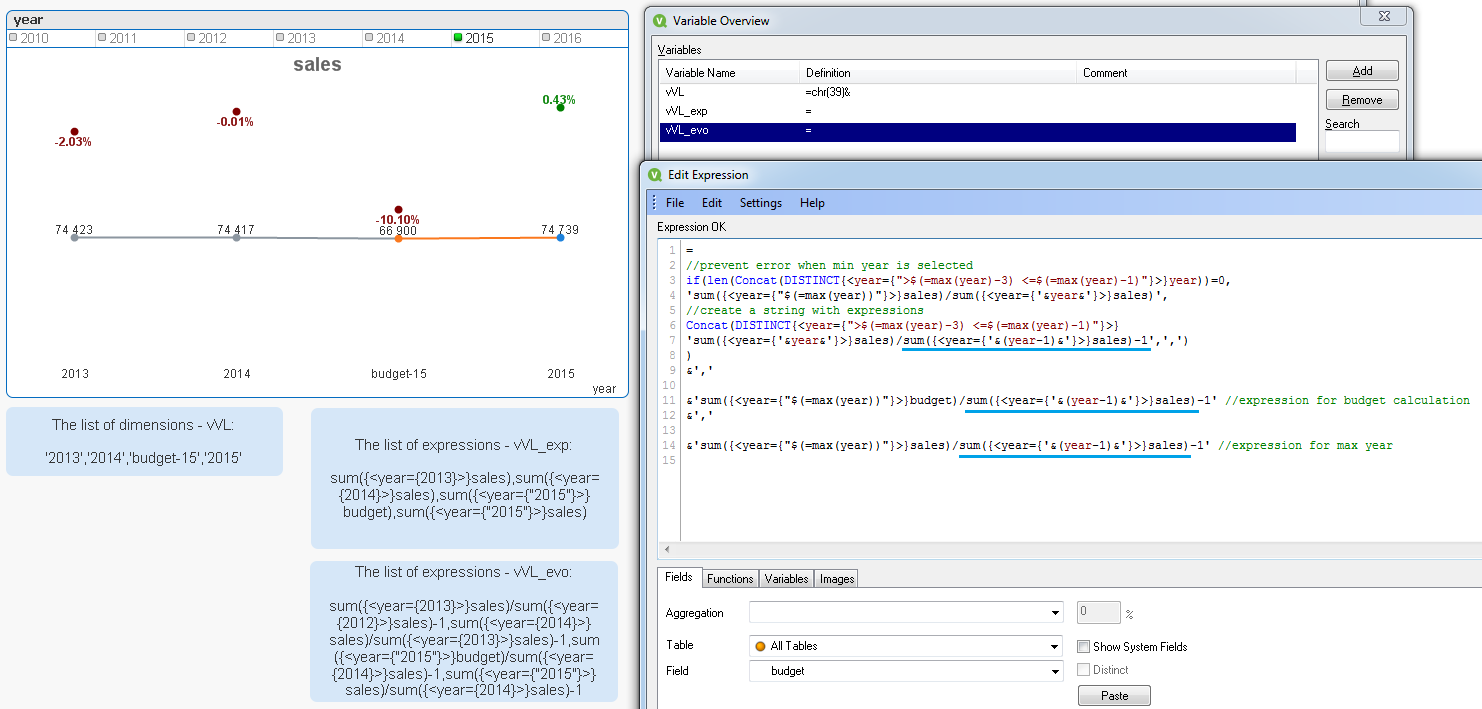
So, all you have to do is to add a previous year as a denominator.
In your case it should be like:
'sum({<ANNEE={'&ANNEE&'}>}CA_NET_EN_DH)/sum({<ANNEE={'&ANNEE&'}>}CA_NET_EN_LITRE)'
/
'sum({<ANNEE={'&(ANNEE-1)&'}>}CA_NET_EN_DH)/sum({<ANNEE={'&(ANNEE-1)&'}>}CA_NET_EN_LITRE)'
-1
for each generated expression.
You can move this expression to the right axis, and then split axis for better vizualization:
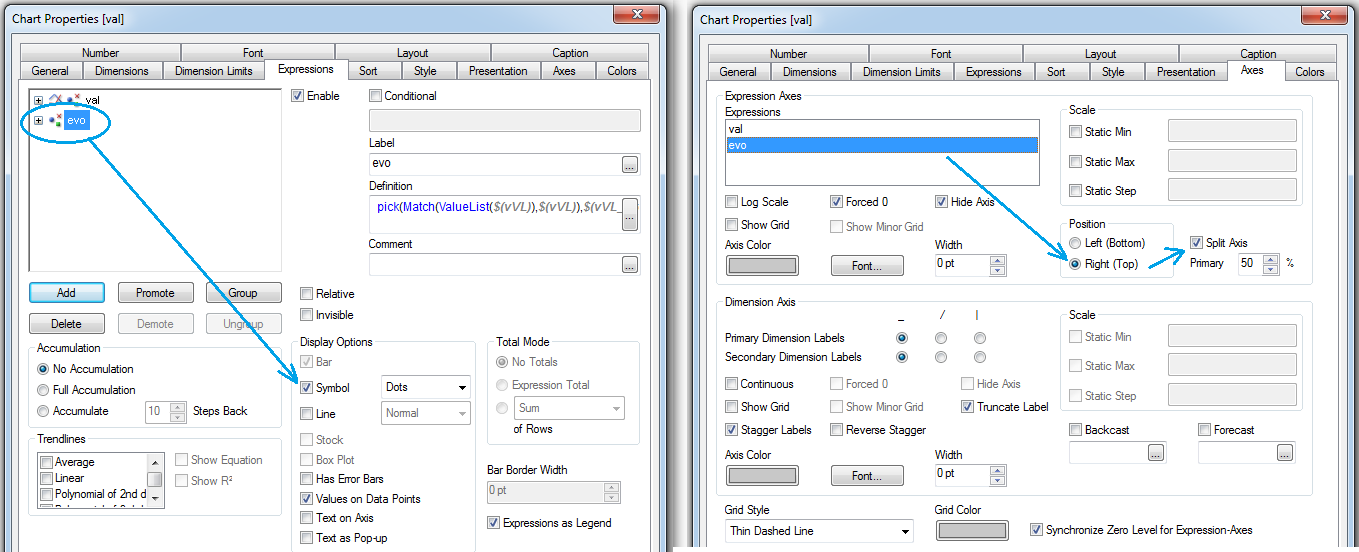
For text color you can use this expression:
if(pick(Match(ValueList($(vVL)),$(vVL)),$(vVL_evo))>0, Green(), Red())
If you want to hide dots you may use a transparent color function aRGB(0,0,0,0)
- Mark as New
- Bookmark
- Subscribe
- Mute
- Subscribe to RSS Feed
- Permalink
- Report Inappropriate Content
hello , thank you so much for your reply,
here is what i did :
1) i create variable with called vVL_evo with this content :
//prevent error when min year is selected
if(len(Concat(DISTINCT{<ANNEE={">$(=max(ANNEE)-3) <=$(=max(ANNEE)-1)"}>}ANNEE))=0,'sum({<ANNEE={"$(=max(ANNEE))"}>}CA_NET_EN_DH)/sum({<ANNEE={"$(=max(ANNEE))"}>}CA_NET_EN_LITRE)'/'sum({<ANNEE={'&(ANNEE-1)&'}>}CA_NET_EN_DH)/sum({<ANNEE={'&(ANNEE-1)&'}>}CA_NET_EN_LITRE)'-1 ,
//create a string with expressions
Concat(DISTINCT{<ANNEE={">$(=max(ANNEE)-3) <=$(=max(ANNEE)-1)"}>}'sum({<ANNEE={'&ANNEE&'}>}CA_NET_EN_DH)/sum({<ANNEE={'&ANNEE&'}>}CA_NET_EN_LITRE)'/'sum({<ANNEE={'&(ANNEE-1)&'}>}CA_NET_EN_DH)/sum({<ANNEE={'&(ANNEE-1)&'}>}CA_NET_EN_LITRE)'-1,',')
)
&','
&'sum({<ANNEE={"$(=max(ANNEE))"}>}BUDGET_CA_NET_DH)/sum({<ANNEE={"$(=max(ANNEE))"}>}BUDGET_CA_NET_LITRE)'/'sum({<ANNEE={'&(ANNEE-1)&'}>}CA_NET_EN_DH)/sum({<ANNEE={'&(ANNEE-1)&'}>}CA_NET_EN_LITRE)'-1 //expression for budget calculation
&','
&'sum({<ANNEE={"$(=max(ANNEE))"}>}CA_NET_EN_DH)/sum({<ANNEE={"$(=max(ANNEE))"}>}CA_NET_EN_LITRE)'/ 'sum({<ANNEE={'&(ANNEE-1)&'}>}CA_NET_EN_DH)/sum({<ANNEE={'&(ANNEE-1)&'}>}CA_NET_EN_LITRE)'-1//expression for max year
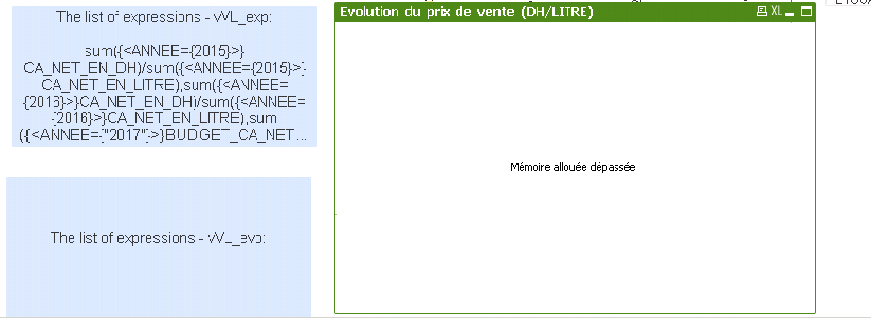
2) i added the expression in the chart line but i get a memory error and the variable vVL_evo ,didn't even appear in the text box ( please see the screenshot)
is there any error in the variable code??
thank you so much in advance
- Mark as New
- Bookmark
- Subscribe
- Mute
- Subscribe to RSS Feed
- Permalink
- Report Inappropriate Content
is the expression of vVL_evo too much big, and should be optimized because i checked the free memory, the server still have enough free memory , please see the screenchot:

- Mark as New
- Bookmark
- Subscribe
- Mute
- Subscribe to RSS Feed
- Permalink
- Report Inappropriate Content
Hello!
There is a typo in condition. Look:
if(
len(Concat(DISTINCT{<ANNEE={">$(=max(ANNEE)-3) <=$(=max(ANNEE)-1)"}>}ANNEE))=0,
'sum({<ANNEE={"$(=max(ANNEE))"}>}CA_NET_EN_DH)/sum({<ANNEE={"$(=max(ANNEE))"}>}CA_NET_EN_LITRE)
'/'sum({<ANNEE={'&(ANNEE-1)&'}>}CA_NET_EN_DH)/sum({<ANNEE={'&(ANNEE-1)&'}>}CA_NET_EN_LITRE)'-1
You should remove single quotes and enclose divided conditions in brakets:
if(
len(Concat(DISTINCT{<ANNEE={">$(=max(ANNEE)-3) <=$(=max(ANNEE)-1)"}>}ANNEE))=0,
'(sum({<ANNEE={"$(=max(ANNEE))"}>}CA_NET_EN_DH)/sum({<ANNEE={"$(=max(ANNEE))"}>}CA_NET_EN_LITRE))/(sum({<ANNEE={'&(ANNEE-1)&'}>}CA_NET_EN_DH)/sum({<ANNEE={'&(ANNEE-1)&'}>}CA_NET_EN_LITRE))'-1
Should work.
- Mark as New
- Bookmark
- Subscribe
- Mute
- Subscribe to RSS Feed
- Permalink
- Report Inappropriate Content
thank you so muh for your help it works now.
However i have one point that i don't need because , logically i should have just three values of the evolution since i have 4 values : sales N-2 , sales N-1, budget N and sales N. the value highlighted in red should not appear. please see the sreenshot .
on the other hand i need in other chart to add more values N-3, N-4 and so on, please can You explain to me the expression of vVL_exp so that i would be able to add more years , thank you so much an im so sorry for distrubiing You .
