Unlock a world of possibilities! Login now and discover the exclusive benefits awaiting you.
- Qlik Community
- :
- All Forums
- :
- QlikView App Dev
- :
- Re: Line chart data
- Subscribe to RSS Feed
- Mark Topic as New
- Mark Topic as Read
- Float this Topic for Current User
- Bookmark
- Subscribe
- Mute
- Printer Friendly Page
- Mark as New
- Bookmark
- Subscribe
- Mute
- Subscribe to RSS Feed
- Permalink
- Report Inappropriate Content
Line chart data
Hi All,
Please help me on this.
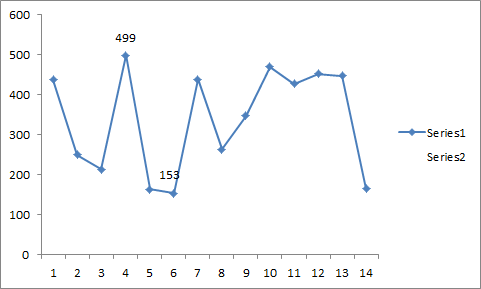
I have added Line Chart which shows year wise sales. I tick the display "values on data point" which shows values all over. My requirement is that I want to display only Max and Min values on data point. Not all values.
Thanks in Advance
- « Previous Replies
-
- 1
- 2
- Next Replies »
- Mark as New
- Bookmark
- Subscribe
- Mute
- Subscribe to RSS Feed
- Permalink
- Report Inappropriate Content
can you post a sample to demonstrate?
If a post helps to resolve your issue, please accept it as a Solution.
- Mark as New
- Bookmark
- Subscribe
- Mute
- Subscribe to RSS Feed
- Permalink
- Report Inappropriate Content
hi, here 499 is highest and 153 is lowest.
- Mark as New
- Bookmark
- Subscribe
- Mute
- Subscribe to RSS Feed
- Permalink
- Report Inappropriate Content
Can you post a sample app with dummy data? Can't demonstrate with an Image!
Preparing examples for Upload - Reduction and Data Scrambling
If a post helps to resolve your issue, please accept it as a Solution.
- Mark as New
- Bookmark
- Subscribe
- Mute
- Subscribe to RSS Feed
- Permalink
- Report Inappropriate Content
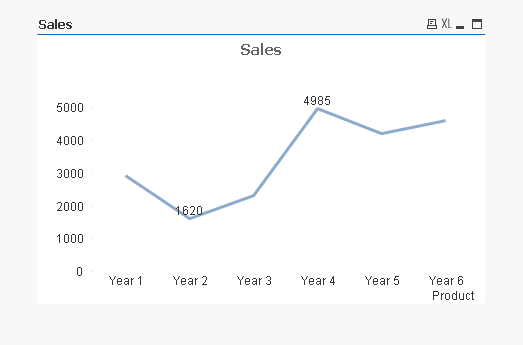
Hi
| Product | Sale |
| Year 1 | 2928 |
| Year 2 | 1620 |
| Year 3 | 2325 |
| Year 4 | 4985 |
| Year 5 | 4199 |
| Year 6 | 4607 |
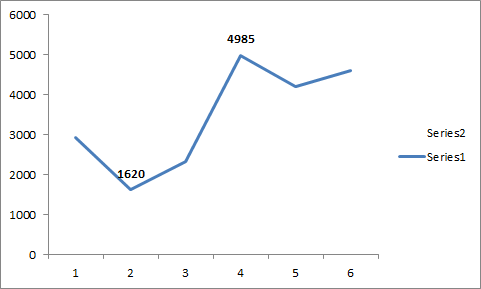
Here it is data table year wise and chart. In table you can see the total sale as per year where Year 2 has lowest sale and Year 4 has highest sale. So chart showing only highest and lowest values.
Please suggest on this.
- Mark as New
- Bookmark
- Subscribe
- Mute
- Subscribe to RSS Feed
- Permalink
- Report Inappropriate Content
See attached App
If a post helps to resolve your issue, please accept it as a Solution.
- Mark as New
- Bookmark
- Subscribe
- Mute
- Subscribe to RSS Feed
- Permalink
- Report Inappropriate Content
Yes, this is what I want. How to do this? please guide me.
- Mark as New
- Bookmark
- Subscribe
- Mute
- Subscribe to RSS Feed
- Permalink
- Report Inappropriate Content
Hi Surya,
This is how vinieme12 did it 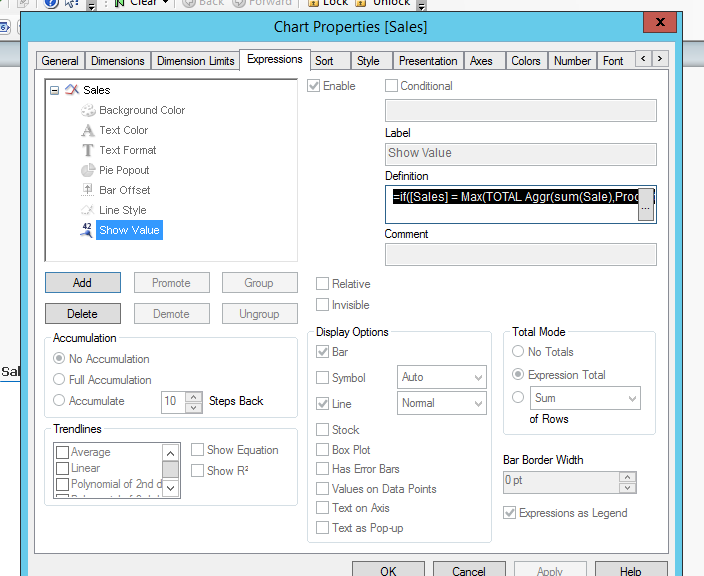
highlighted expression in black:
=if([Sales] = Max(TOTAL Aggr(sum(Sale),Product)) or [Sales] = Min(TOTAL Aggr(sum(Sale),Product)) ,1,0)
Thanks,
Ganesh
- Mark as New
- Bookmark
- Subscribe
- Mute
- Subscribe to RSS Feed
- Permalink
- Report Inappropriate Content
Thanks for pointing that out to the OP 
If a post helps to resolve your issue, please accept it as a Solution.
- « Previous Replies
-
- 1
- 2
- Next Replies »