Unlock a world of possibilities! Login now and discover the exclusive benefits awaiting you.
- Qlik Community
- :
- All Forums
- :
- QlikView App Dev
- :
- Line chart on top of stacked bar - set axis scale
- Subscribe to RSS Feed
- Mark Topic as New
- Mark Topic as Read
- Float this Topic for Current User
- Bookmark
- Subscribe
- Mute
- Printer Friendly Page
- Mark as New
- Bookmark
- Subscribe
- Mute
- Subscribe to RSS Feed
- Permalink
- Report Inappropriate Content
Line chart on top of stacked bar - set axis scale
Hi everyone,
I am trying to overlay a line chart on a stacked bar chart. How can I ensure that no matter what the current selection is, the two charts will have the same axis scale?
Accepted Solutions
- Mark as New
- Bookmark
- Subscribe
- Mute
- Subscribe to RSS Feed
- Permalink
- Report Inappropriate Content
yes whatever suits: e.g. axis: max( [expr] ) - to make sure the extreme ends are the same
- Mark as New
- Bookmark
- Subscribe
- Mute
- Subscribe to RSS Feed
- Permalink
- Report Inappropriate Content
In Chart properties, set the static min and max for the y-axis.
Take care that the x-axis works simultaneously e.g. on the Dimension tab: check (or uncheck) Suppress When Value is Null.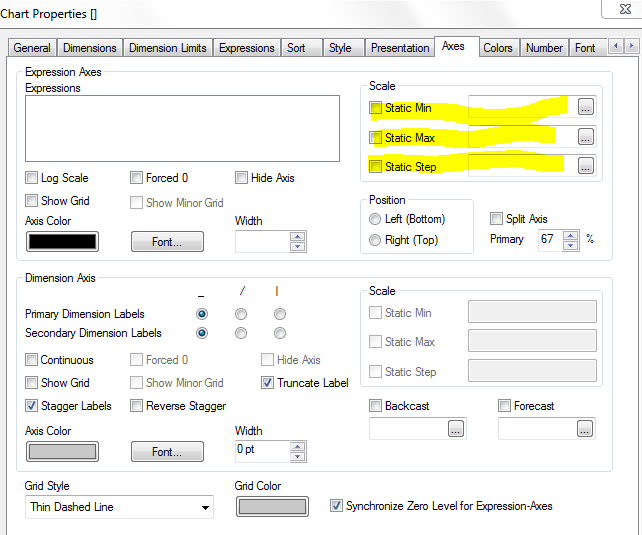
- Mark as New
- Bookmark
- Subscribe
- Mute
- Subscribe to RSS Feed
- Permalink
- Report Inappropriate Content
Hi,
Try like this
Chart Properties-> Axes -> Specify the values for Static Min, Static Max and Static Step values.
Hope this helps you.
Regards,
Jagan.
- Mark as New
- Bookmark
- Subscribe
- Mute
- Subscribe to RSS Feed
- Permalink
- Report Inappropriate Content
Thanks for your responses.
The problem is, I want the axes to be able to adjust for different selections. If I set static min and max, some selections will look very small. I just want the two graphs to have linked axes so they match up perfectly - right now, they will match for one selection, but in the next selection the max values will have very different heights.
- Mark as New
- Bookmark
- Subscribe
- Mute
- Subscribe to RSS Feed
- Permalink
- Report Inappropriate Content
Is there a way to write expressions for the static min/max/step of one graph to equal the other graph?
- Mark as New
- Bookmark
- Subscribe
- Mute
- Subscribe to RSS Feed
- Permalink
- Report Inappropriate Content
yes whatever suits: e.g. axis: max( [expr] ) - to make sure the extreme ends are the same
- Mark as New
- Bookmark
- Subscribe
- Mute
- Subscribe to RSS Feed
- Permalink
- Report Inappropriate Content
Hi,
You can give the same expression to the charts then the values are same in both the charts, the expressions may be something like this
Max(SomeDimension)
Min(SomeDimension)
etc.
Regards,
Jagan.
- Mark as New
- Bookmark
- Subscribe
- Mute
- Subscribe to RSS Feed
- Permalink
- Report Inappropriate Content
Hi guys,
Thank you so much. It seems to be working, but for some reason, it says there is an error in expression. Could you take a quick look at this expression and say why? In the chart Axis tab, I checked 'Static Max', and I put for expression:
=max(sum({<[Project Name]-={'Apples'}>}Amounts))
The { before Apples was underlined red. I don't know why.
Thanks!
- Mark as New
- Bookmark
- Subscribe
- Mute
- Subscribe to RSS Feed
- Permalink
- Report Inappropriate Content
Hi,
when you -= in set analysis it will show as syntax error but it works it is a bug in qlikview, you can ignore that.
Regards,
Jagan.
- Mark as New
- Bookmark
- Subscribe
- Mute
- Subscribe to RSS Feed
- Permalink
- Report Inappropriate Content
Thank you Jagan for the explanation!