Unlock a world of possibilities! Login now and discover the exclusive benefits awaiting you.
- Qlik Community
- :
- All Forums
- :
- QlikView App Dev
- :
- Re: Line chart question
- Subscribe to RSS Feed
- Mark Topic as New
- Mark Topic as Read
- Float this Topic for Current User
- Bookmark
- Subscribe
- Mute
- Printer Friendly Page
- Mark as New
- Bookmark
- Subscribe
- Mute
- Subscribe to RSS Feed
- Permalink
- Report Inappropriate Content
Line chart question
hello i want to create a line chart which counts the material produced every minute. I have an sql db with date and time (23.05.2017 23:30:10) for measure i will count a column. When i add the Date column from sql i see multiple dates as dimension. I need to see the number of produced products every minute. So i dont want to see date as dimension but minute.
I hope i am clear.
- Tags:
- qlikview_scripting
- « Previous Replies
-
- 1
- 2
- Next Replies »
- Mark as New
- Bookmark
- Subscribe
- Mute
- Subscribe to RSS Feed
- Permalink
- Report Inappropriate Content
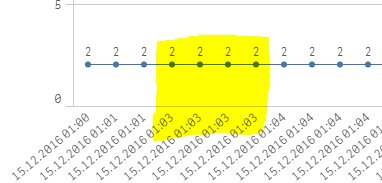
hello in addition to code i deleted seconds from data manager, because in dimension it still displayed seconds.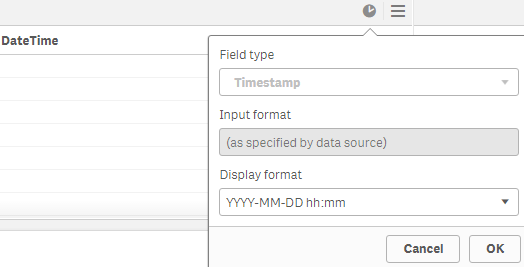
now the graphic is as below, there is still 4 from same minute . i need 1 value which will be 8 in the yellow marked area as 12:12:2016 01:03
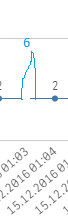
it should be like this
- Mark as New
- Bookmark
- Subscribe
- Mute
- Subscribe to RSS Feed
- Permalink
- Report Inappropriate Content
Deleting seconds from the format does not change the underlying value, so you still have seconds value - they only look like minute values. To ensure proper minute values, round the datetime to the nearest minute
TimeStamp(Round(DateTime, 1/1440), 'yyyy.MM.dd hh:mm')
(1440 is the number of minutes in a 24h day)
- Mark as New
- Bookmark
- Subscribe
- Mute
- Subscribe to RSS Feed
- Permalink
- Report Inappropriate Content
sorry i couldn't find the place to write this
TimeStamp(Round(DateTime, 1/1440), 'yyyy.MM.dd hh:mm')
is it the main section at data load editor SET .....
or the code you send(where exacly)
- Mark as New
- Bookmark
- Subscribe
- Mute
- Subscribe to RSS Feed
- Permalink
- Report Inappropriate Content
i wrote it as dimension expression , the result is as below, i just dont need the seconds that is all

- Mark as New
- Bookmark
- Subscribe
- Mute
- Subscribe to RSS Feed
- Permalink
- Report Inappropriate Content
If you provide the full script, as has already been requested, I will be able to show you exactly where to put that statement. Use it for the fact table load statement (ie where you load DateTime).
- Mark as New
- Bookmark
- Subscribe
- Mute
- Subscribe to RSS Feed
- Permalink
- Report Inappropriate Content
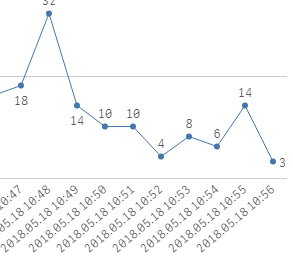
i copied the script below. the graph is currently as below. But counts wrong, normally at sql db there is 7 references at "2018.05.18 10:56" but graph counts 3.
dimension = TimeStamp(Round(DateTime, 1/1440), 'yyyy.MM.dd hh:mm')
measure = count(referans)
- Mark as New
- Bookmark
- Subscribe
- Mute
- Subscribe to RSS Feed
- Permalink
- Report Inappropriate Content
LOAD
[ID],
APPLYMAP( 'CELLNOMapping', [CELLNO]) AS [CELLNO],
TimeStamp(Round(DateTime, 1/1440), 'yyyy.MM.dd hh:mm') AS [DateTimeM],
Timestamp([DateTime] ,'YYYY-MM-DD hh:mm[:ss[.fff]]') AS [DateTime],
[Referans];
SQL SELECT "ID",
"CELLNO",
"DateTime",
"Referans"
FROM "MidProduct"."dbo"."URT_BASE";
Use DateTimeM as the chart dimension. You need DateTime to keep the association with the calendar.
- Mark as New
- Bookmark
- Subscribe
- Mute
- Subscribe to RSS Feed
- Permalink
- Report Inappropriate Content
01:12:03
Output cleared.
01:12:05
---
Started loading data
---
---
The following error occurred:
ApplyMap error:
map_id not found
---
The error occurred here:
LOAD
[ID],
APPLYMAP( 'CELLNOMapping', [CELLNO]) AS [CELLNO],
TimeStamp(Round(DateTime, 1/1440), 'yyyy.MM.dd hh:mm') AS [DateTimeM],
Timestamp([DateTime] ,'YYYY-MM-DD hh:mm[:ss[.fff]]') AS [DateTime],
[Referans]
---
The following error occurred:
ApplyMap error:
map_id not found
---
The error occurred here:
?
---
Data has not been loaded. Please correct the error and try loading again.
01:12:08
App successfully saved.
- Mark as New
- Bookmark
- Subscribe
- Mute
- Subscribe to RSS Feed
- Permalink
- Report Inappropriate Content
Hi Erhan, the dates are different (different second), so it will be different values, to show only only dimension value per minute you need to create the field that has the exact same value for every minute. That is, removing seconds and miliseconds:
TimeStamp(Floor(Timestamp#(DateTime, 'YYYY-MM-DD hh:mm:ss.fff'), 1/1440)) as DateTime
Check attachment.
- Mark as New
- Bookmark
- Subscribe
- Mute
- Subscribe to RSS Feed
- Permalink
- Report Inappropriate Content
hello it works with with your file. now i'm trying to put the code inside my dashboard
- « Previous Replies
-
- 1
- 2
- Next Replies »